Answer the question
In order to leave comments, you need to log in
Interpolation of unstructured 3-dimensional data?
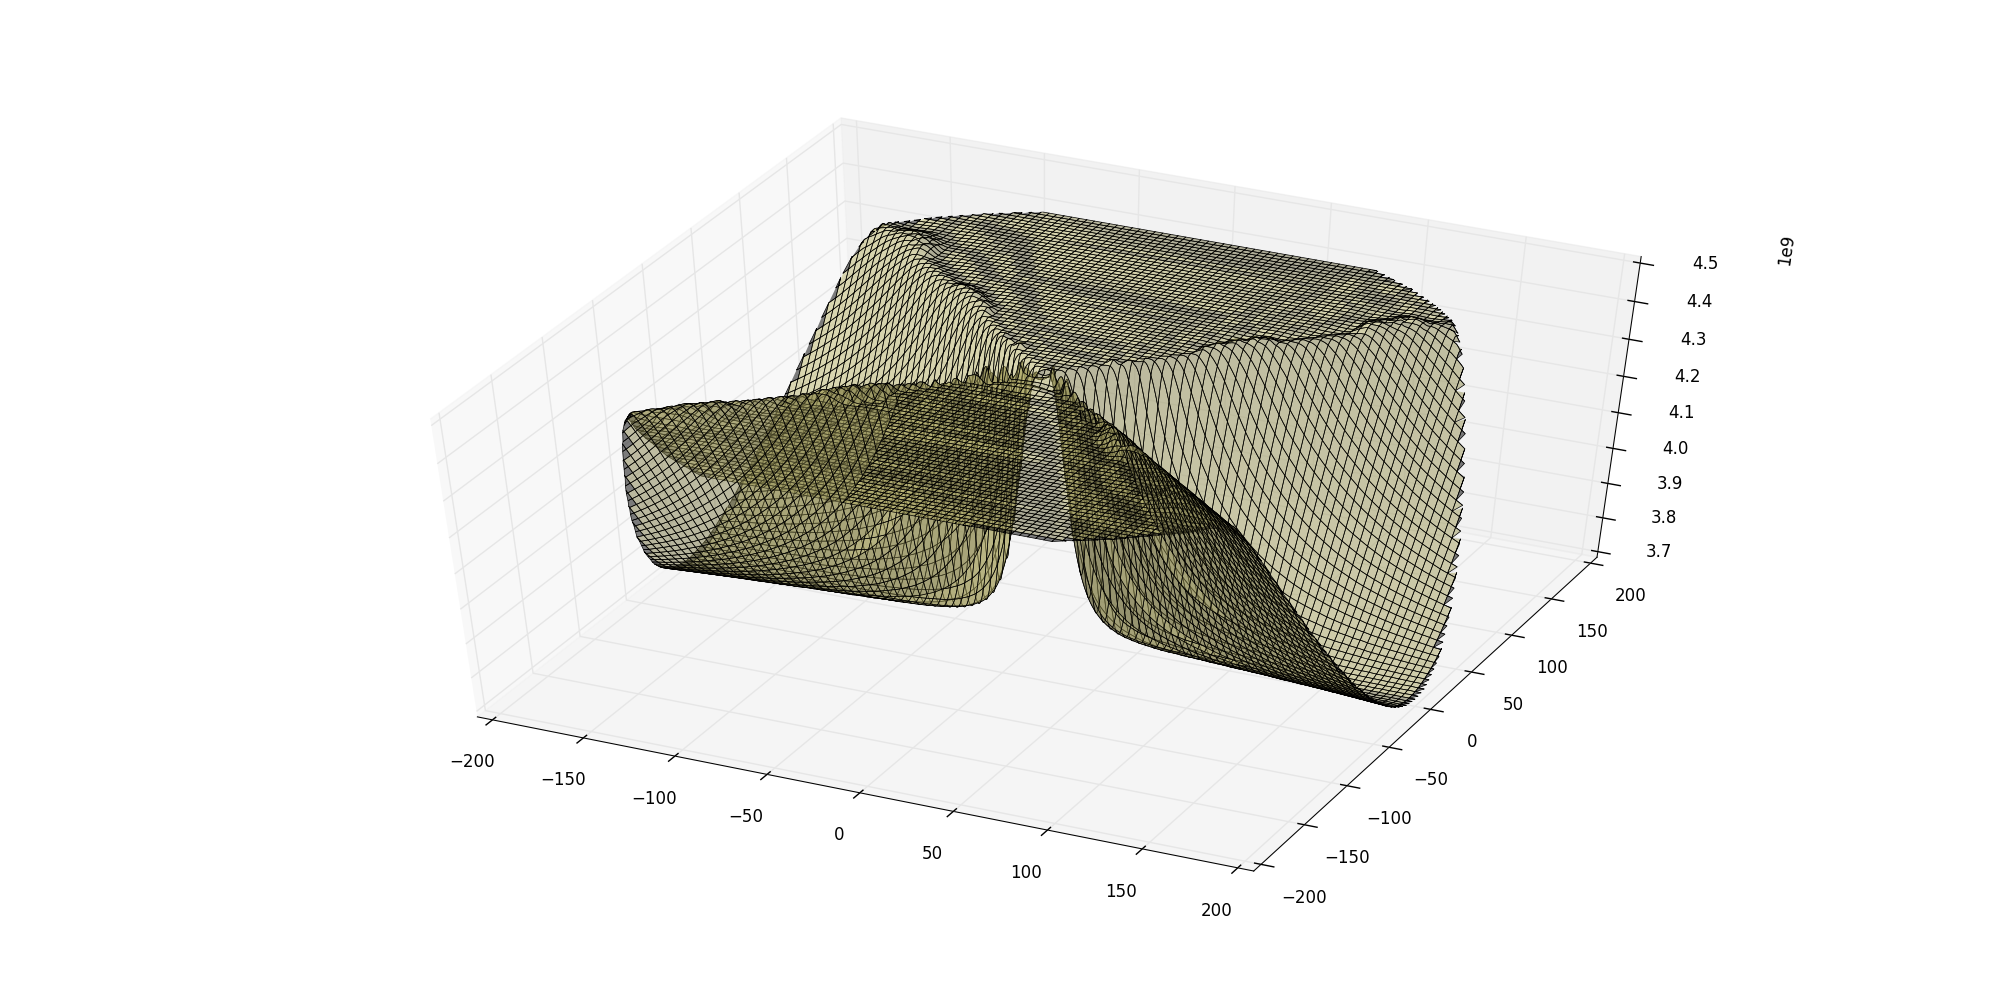
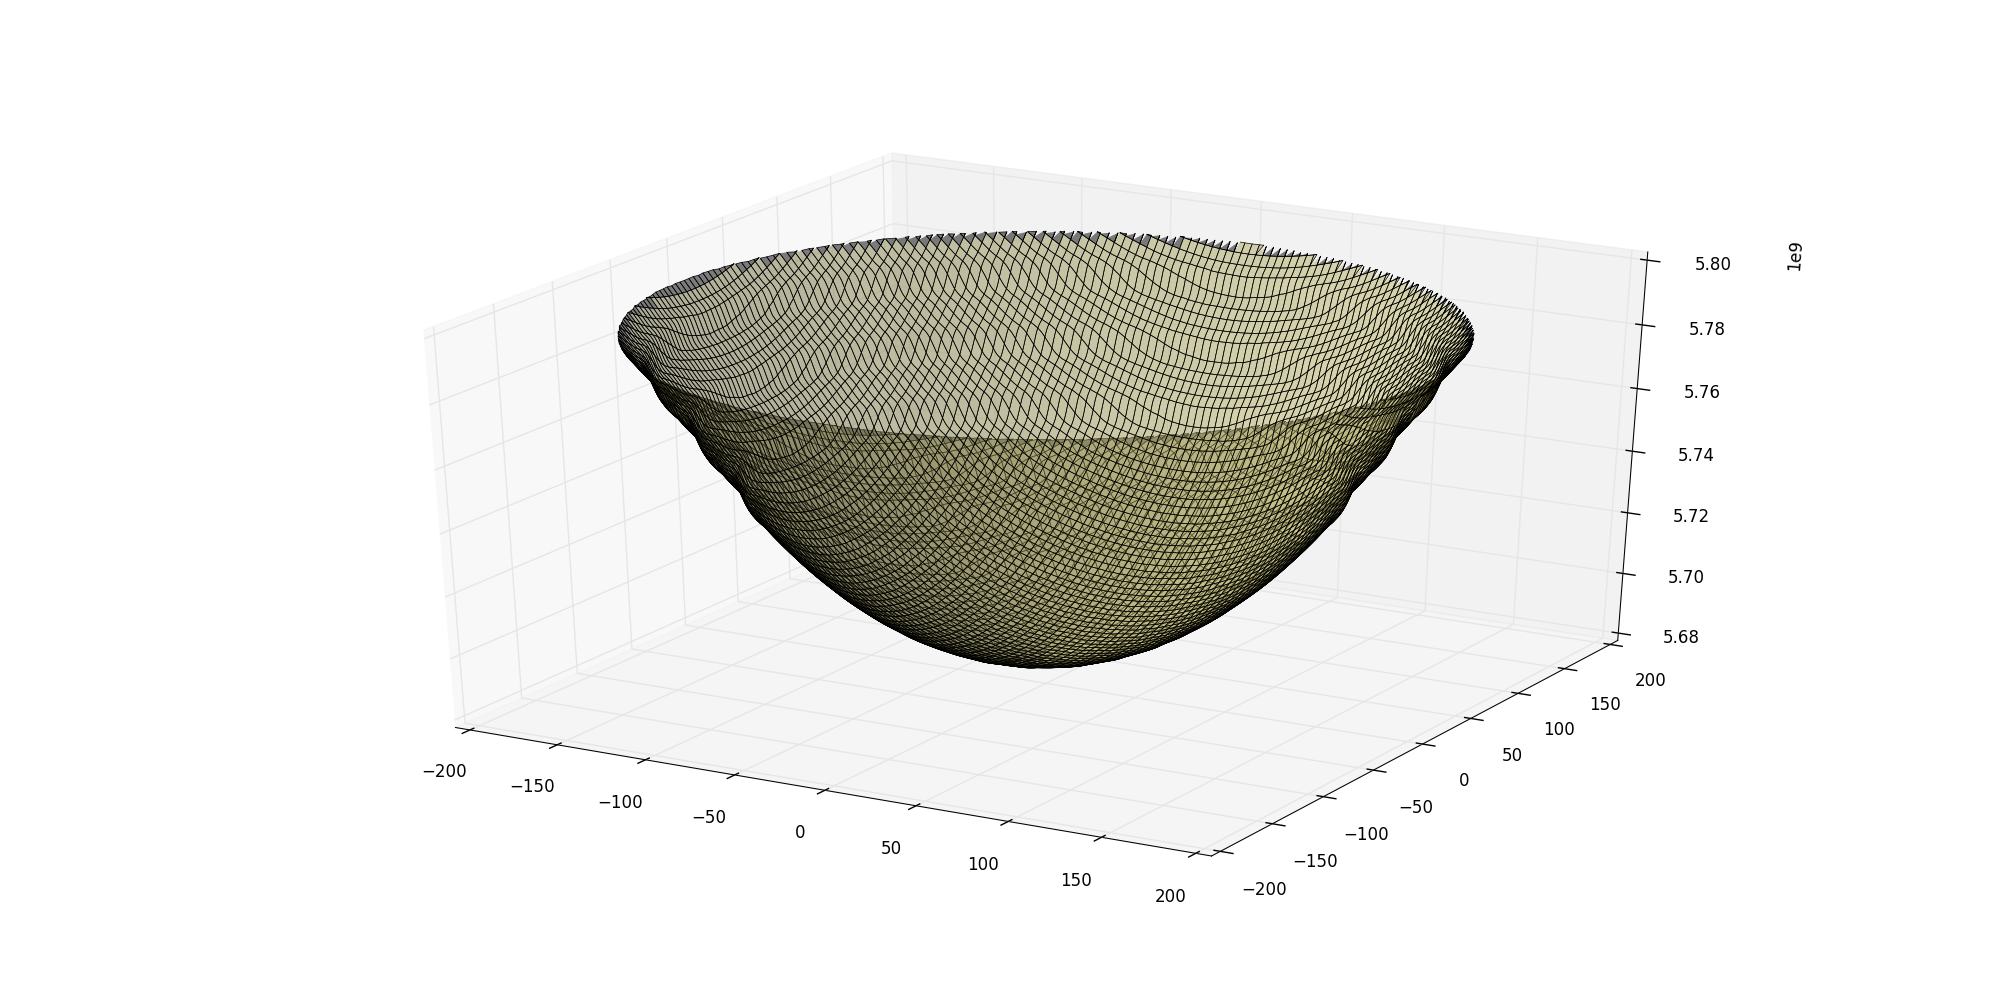
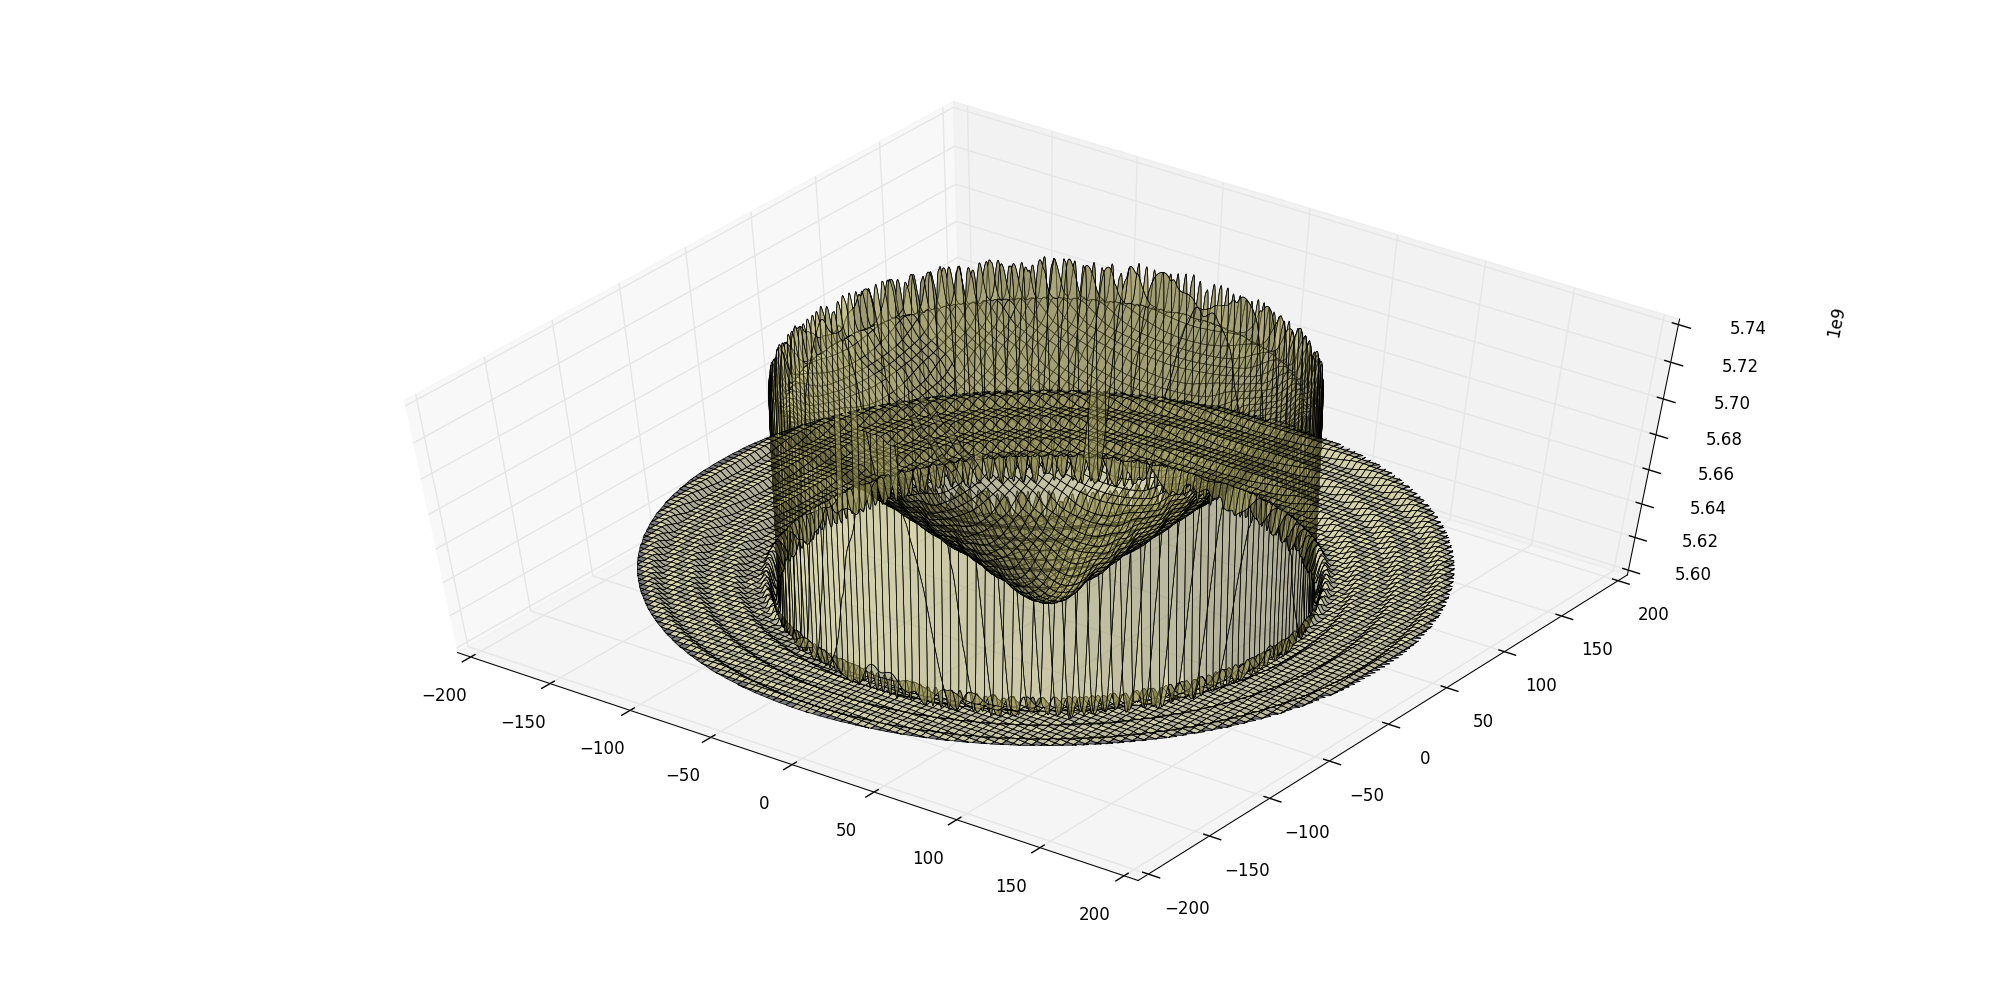
I already asked about this, here . But then it was not possible to ask a very specific question. So, I repeat. There is a set of points, 3D:
| x | y | z |
|---|---|---|
| 0.8316467632710912 | 3.9125904029352112 | 4.2460486461065035e+009 |
| 1.1025494232680673 | 3.8450467837532551 | 4.2460486461065035e+009 |
| 1.6269465723033014 | 3.6541818305703586 | 4.2460486461065035e+009 |
| ... | ... | ... |
| 0.8370776849271087 | -11.9707686031180580 | 4.2380933897388258e+009 |
| -0.0000000000024552 | -12.0000000000000000 | 4.2359237743658228e+009 |
| -0.8370776849320072 | -11.9707686031177150 | 4.2337541589928198e+009 |
| ... | ... | ... |
import numpy as np
from mpl_toolkits.mplot3d import Axes3D
import matplotlib.pyplot as plt
from scipy.interpolate import griddata

fig = plt.figure(figsize=plt.figaspect(0.5))
ax = fig.gca(projection='3d')
my_data = np.genfromtxt('data.csv', delimiter=',',skiprows=0)
X = my_data[:,0]
Y = my_data[:,1]
Z = my_data[:,2]

xi = np.linspace(X.min(),X.max(),1000)
yi = np.linspace(Y.min(),Y.max(),1000)

zi = griddata((X, Y), Z, (xi[None,:], yi[:,None]), method='cubic')

xig, yig = np.meshgrid(xi, yi)

surf = ax.plot_surface(xig, yig, zi,linewidth=0.5,color='DarkKhaki',alpha=0.50)

plt.show()


Answer the question
In order to leave comments, you need to log in
Nothing needs to be interpolated. You need a 3d graph.
gnuplot should work.
Didn't find what you were looking for?
Ask your questionAsk a Question
731 491 924 answers to any question