Answer the question
In order to leave comments, you need to log in
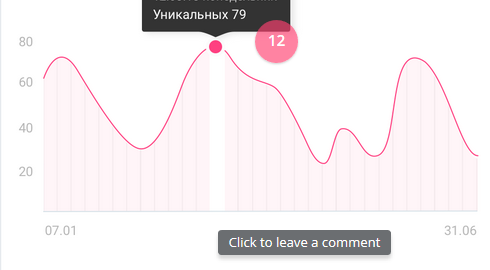
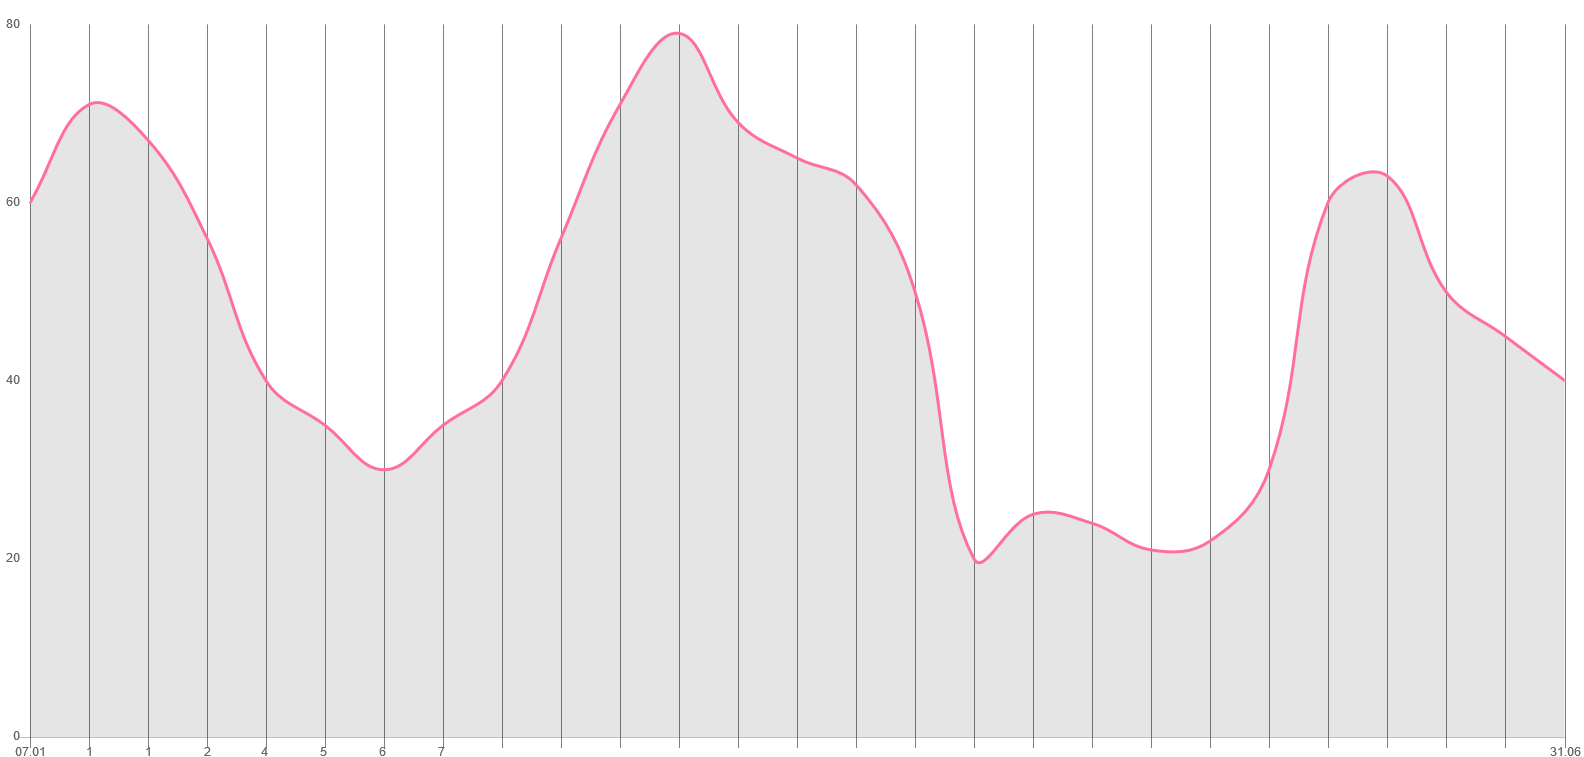
I work with the Chart.js library under react. How to make the gridlines to be limited to the graph? And the value on the lower x-axis to be limited to the extremes?
class Chart extends Component {

  constructor(props){
    super(props);
    this.state = {
      chartData:{
        labels: ['07.01', '1', "1", '2' , '4 ','5 ','6 ','7 ',' ',' ',' ',' ',' ',' ',' ',' ',' ',' ',' ',' ',' ',' ',' ',' ',' ',' ',
      '31.06'],
        datasets: [
          {
            label:'Уникальных',
            data: [
              60,71,67,56,40,35,30,35,40,56,71,79,69,65,62,50,20,25,24,21,22,30,60,63,50,45,40
            ],

            borderColor: "#FF6E9F",
            fill:true,
            pointHoverBackgroundColor: '#FF6E9F' ,
            pointHoverBorderColor: "white",
            pointHoverBorderWidth: "10",
            pointHoverRadius: "15",
            pointRadius: '0.5',


          }
        ]
      }
    }
  }

  static defaultProps = {
    displayTitle: true,
    displayLegend: false,
    legendPosition: 'bottom',
    titlePosition: 'top',

    }

  render(){
    return(
      <div className="chart">
        <Line
          data={this.state.chartData}
          width={200}
          height={100}
          options={{
            title:{
            display: this.props.displayTitle,
            text: 'КОЛ-ВО ПОСЕТИТЕЛЕЙ',
            defaultFontFamily: "Proxima Nova",
            padding: '18',
            fontSize: '12',
            position: this.props.titlePosition
          },
          legend:{
            display: this.props.displayLegend,
            position: this.props.legendPosition,
            usePointStyle : true,
            labels: {
              fontColor: '#354052',
              fontFamily: "Proxima Nova",
            	usePointStyle: true,
            }
          },
          tooltips: {
            displayColors: false,
          },
          scales: {
           yAxes: [{
               ticks: {
                   beginAtZero: true,
                   maxTicksLimit: 6
               },
               gridLines: {
                  color: "rgba(0, 0, 0, 0)",
                }
           }],
           xAxes: [{
               ticks: {
                   maxTicksLimit: 50,
               },
               gridLines: {
                   drawBorder: false,
                   color: "gray",
                }
           }]
       }

          }}
          />
      </div>
    )
  }
}Answer the question
In order to leave comments, you need to log in
Didn't find what you were looking for?
Ask your questionAsk a Question
731 491 924 answers to any question