Answer the question
In order to leave comments, you need to log in
How was this chart built?
I study the solution of the task with the titanic with Kaggle. We met a similar kind of graphics:
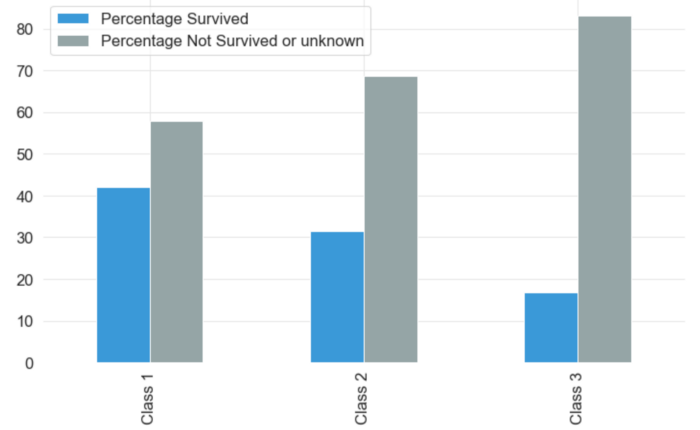
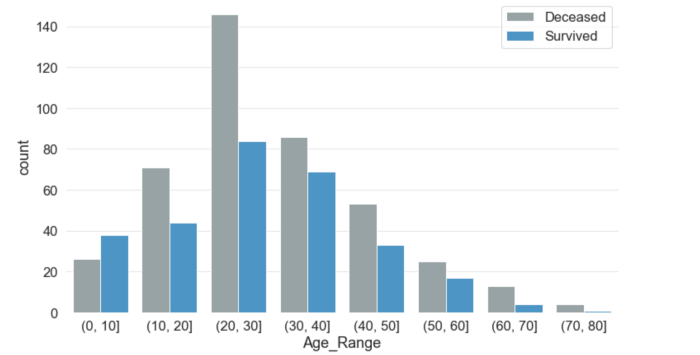
SeaBorn is indicated in the libraries used, but I could not find something similar in it. How do you build the same graphs as in the picture?
Here is a link to the article
Answer the question
In order to leave comments, you need to log in
Didn't find what you were looking for?
Ask your questionAsk a Question
731 491 924 answers to any question