Answer the question
In order to leave comments, you need to log in
How to visualize an elliptic curve?
An elliptic curve is given by the formula, for example
y2 = x3 - x + 1
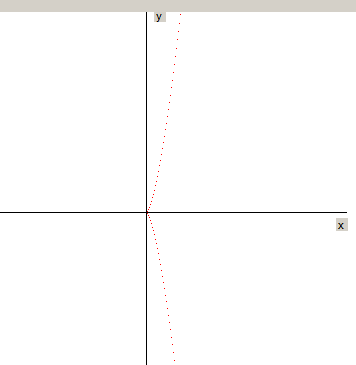
Run poix by the formula
y = Convert::ToInt32(sqrt((double)(x*x*x + a*x + b)));
And we get something similar to a parabola
. How to achieve such a graph? As in Wikipedia

I can not understand Something.
Answer the question
In order to leave comments, you need to log in
Have you tried substituting a=-1, b=1 into your formula?
For x=-1, your formula will return y= 1.
Why it doesn't draw anything, I can't tell without seeing all of your code. Perhaps something breaks there because of the roots of negative numbers. Need to check first. that x^3+ax+b >= 0, and only in this case calculate y and draw points. And, yes, you need to loop through x from negative numbers too.
You can first solve the equation x^3+ax+b = 0 to understand the domain of the function.
Didn't find what you were looking for?
Ask your questionAsk a Question
731 491 924 answers to any question