Answer the question
In order to leave comments, you need to log in
How to understand how much RAM a method eats?
There is a fairly massive method that processes data arrays.
On the server, it eats a lot of RAM. I need to find the reason exactly where he eats it.
How to find this location using chrome://inspect.
Made 3 snapshots:
This is at the place of a certain breakpoint in a certain iteration 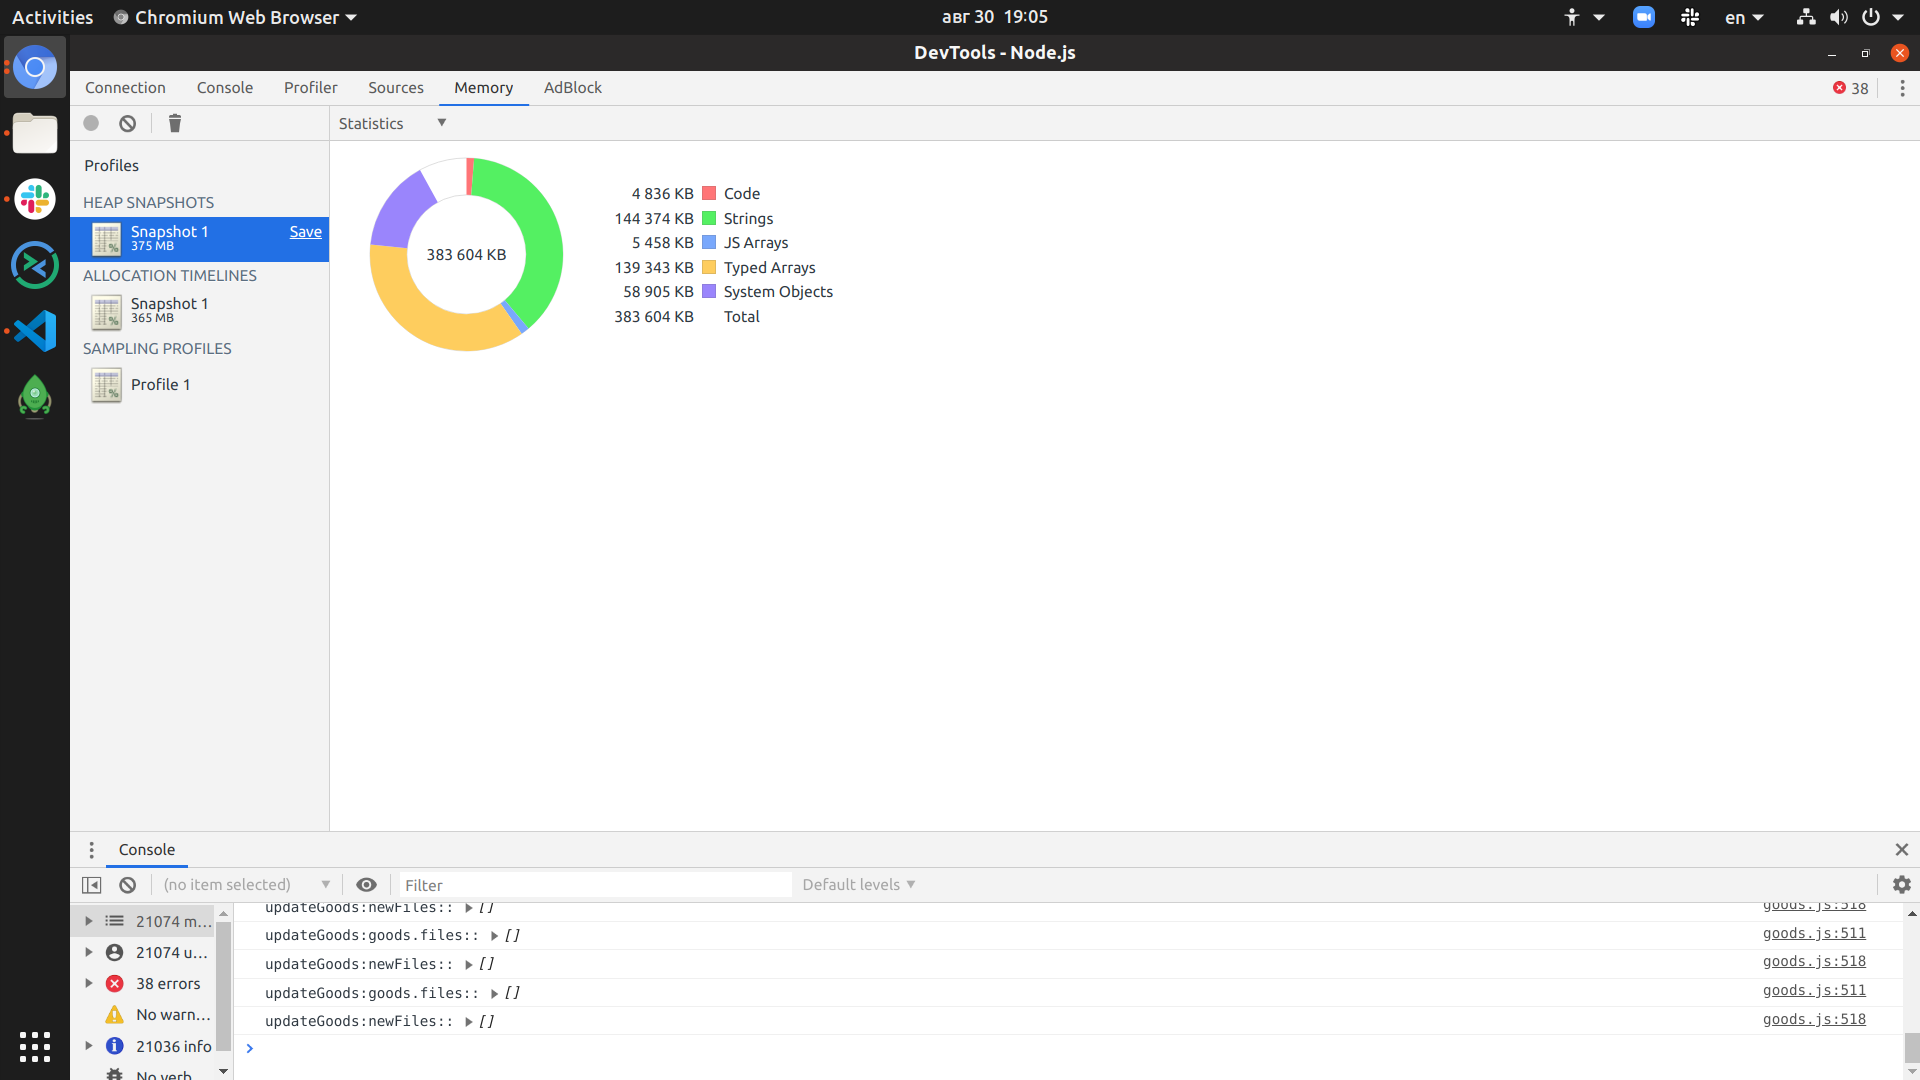
. This is in a certain period, the initial one. 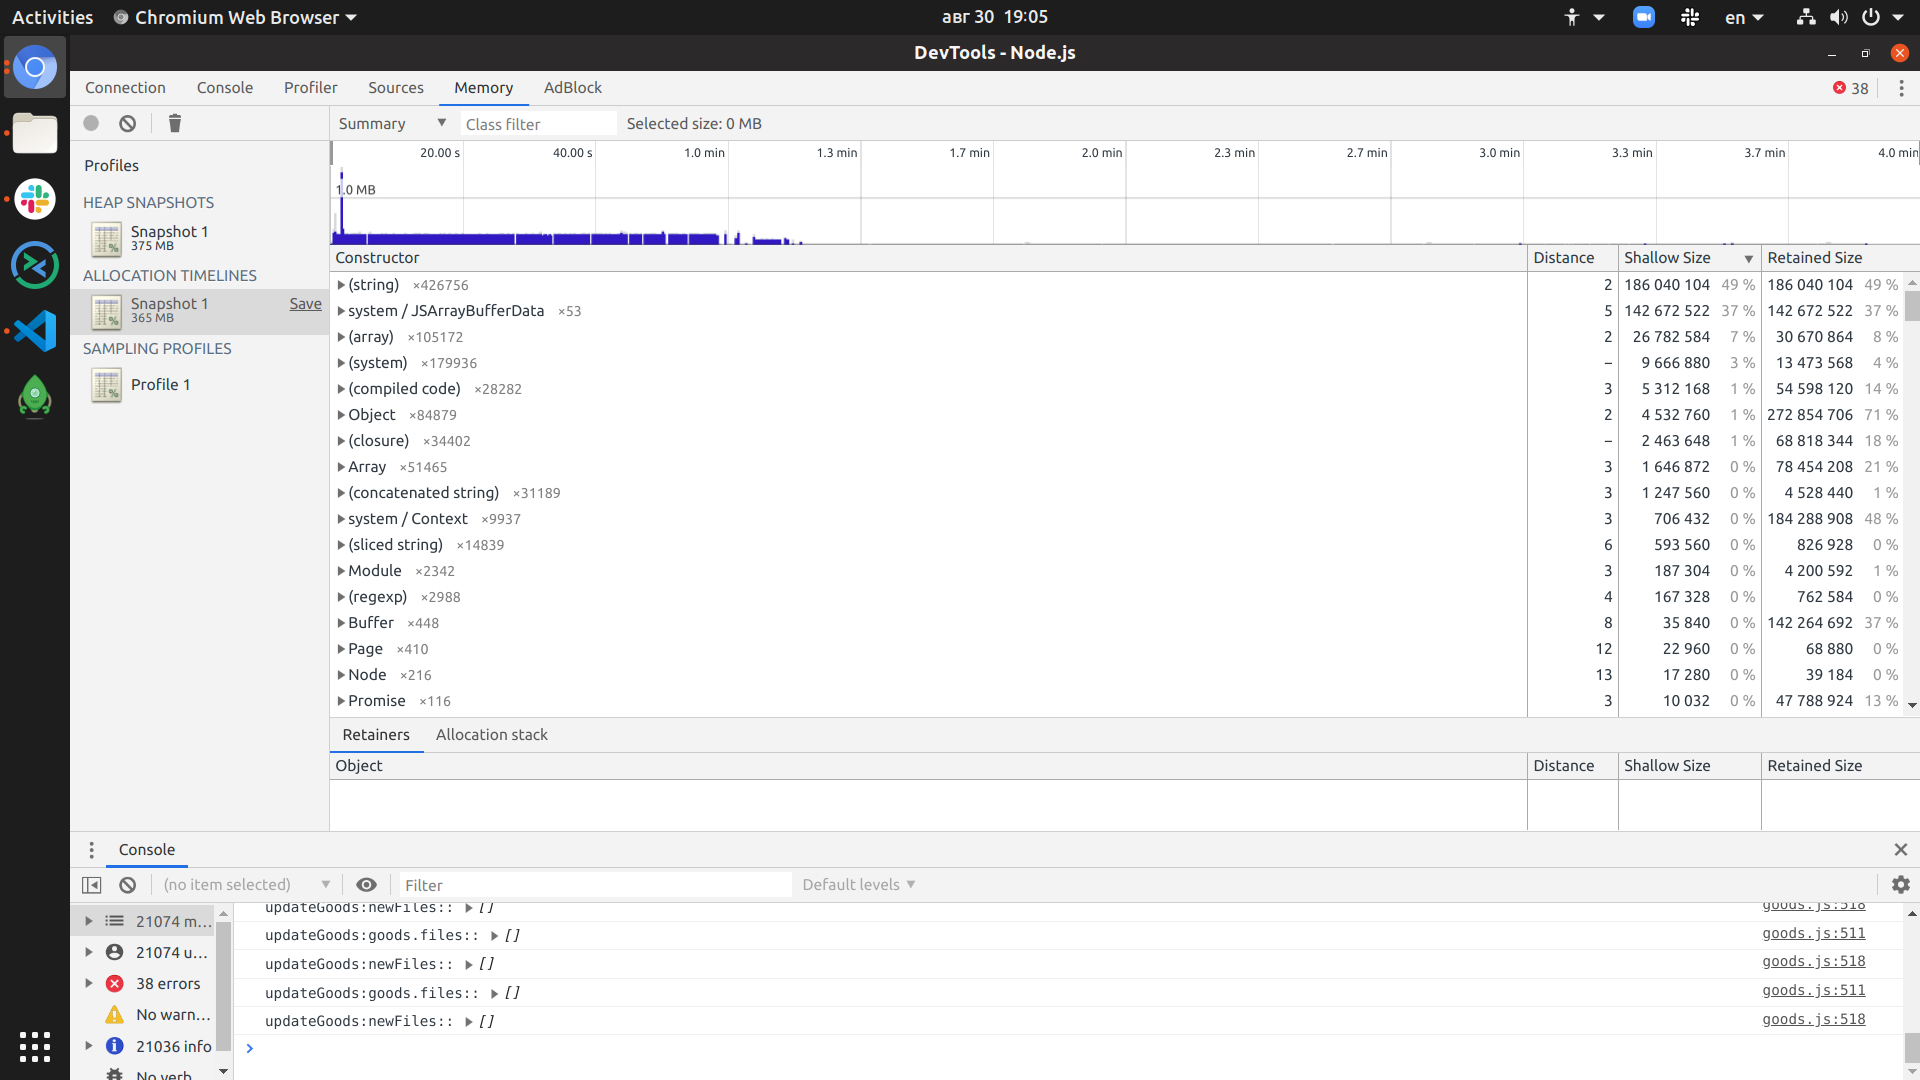
This is for the entire period of the method. 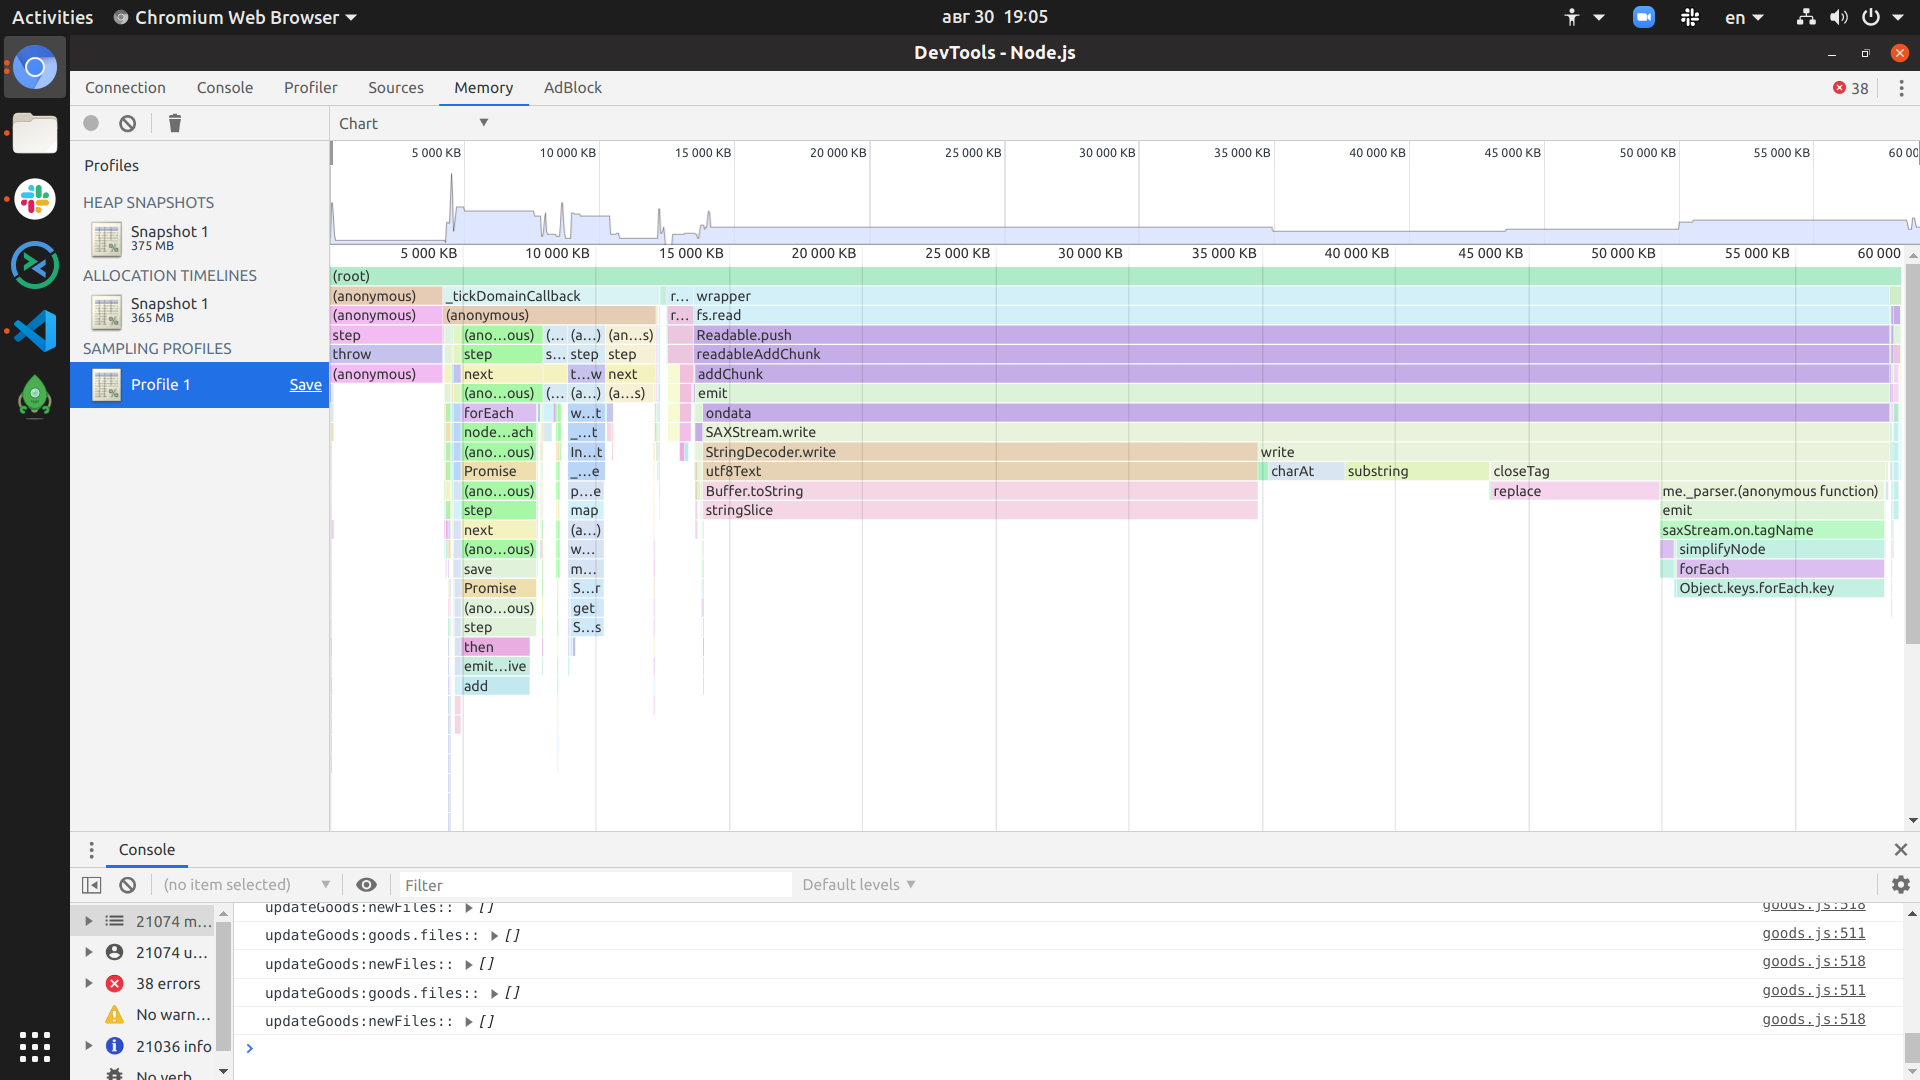
But I don’t understand what they show. How to find what I need?
Answer the question
In order to leave comments, you need to log in
try to read here: https://www.toptal.com/nodejs/debugging-memory-lea...
Well, in general, google how to find memory leaks and work with heap snapshots in a node. There is no universal answer, but there are methods that can help you. Heap diff helps if you know the moment when the memory is occupied and you can make and compare two snapshots before and after, find what the memory is occupied with and try to find the context with which this data is associated and from the context you may find a method.
Didn't find what you were looking for?
Ask your questionAsk a Question
731 491 924 answers to any question