Answer the question
In order to leave comments, you need to log in
How to show percentage in google spreadsheets?
You need to see what percentage of answers are in the range. Example:
Vasya - 10
Misha - 10
Sasha - 8
Andrey - 7
Arseniy - 6
Maxim - 10
Olya - 3
and so on...
Find out:
How much% from 9 to 10
How much% from 7 to 8
how much% from 0 to 6
Answer the question
In order to leave comments, you need to log in
This is called the frequency of occurrence of a value in a range across groups.
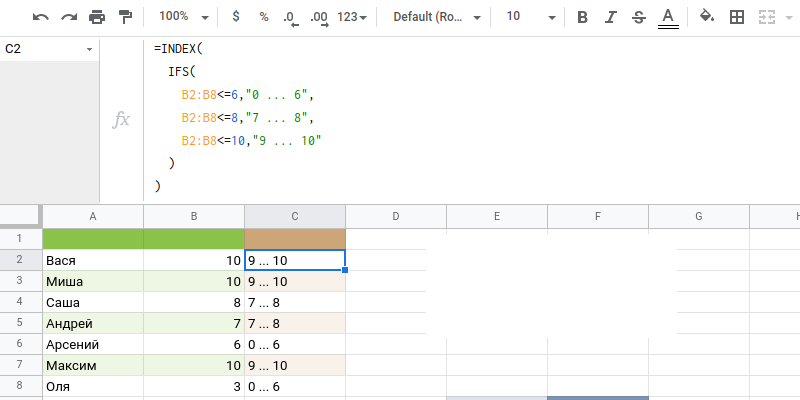
You need to build a list of categories or sections to which you will attribute certain data. It can be both strings and numbers. Because there is no special meaning in numbers (we count quantities), then you can immediately make signature lines

=INDEX(
  IFS(
    B2:B8<=6,"0 ... 6",
    B2:B8<=8,"7 ... 8",
    B2:B8<=10,"9 ... 10"
  )
)
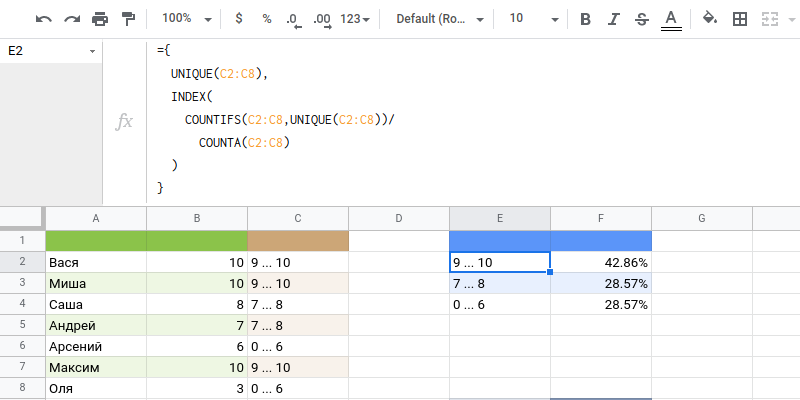
={
  UNIQUE(C2:C8),
  INDEX(
    COUNTIFS(C2:C8,UNIQUE(C2:C8))/
      COUNTA(C2:C8)
  )
}
Didn't find what you were looking for?
Ask your questionAsk a Question
731 491 924 answers to any question