Answer the question
In order to leave comments, you need to log in
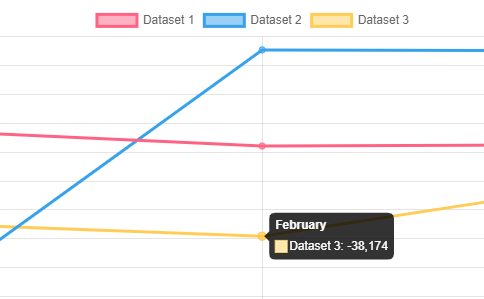
How to show all labels of all datasets in Chart JS line chart on hover?
https://www.chartjs.org/docs/latest/samples/line/l...
Here is a Line-chart, It is 
necessary that when hovering over one point, as on the screen, the labels of all datasets are shown
(that is, both yellow and blue and red dots and not just yellow) that lie on February.
How to do this using Chart js?
Answer the question
In order to leave comments, you need to log in
Didn't find what you were looking for?
Ask your questionAsk a Question
731 491 924 answers to any question