Answer the question
In order to leave comments, you need to log in
How to set up xdebug + phpstorm on remote server 2.0?
I’ll write right away for those who reach out for remarks like “they didn’t teach you to google” or “there is a tradition on the toaster”, I rummaged sooooo much, at first a harmless yet another misunderstanding of the situation seemed temporary, but after sorting through a lot of material on this topic. I already think this is a real problem that I'm not the only one facing. I really hope for the help of people who will show practical advice where to dig. I asked this question a week ago, but a couple of comments ridiculed the question, apparently it was my fault that the question was superficially stated, and without special code and pictures.
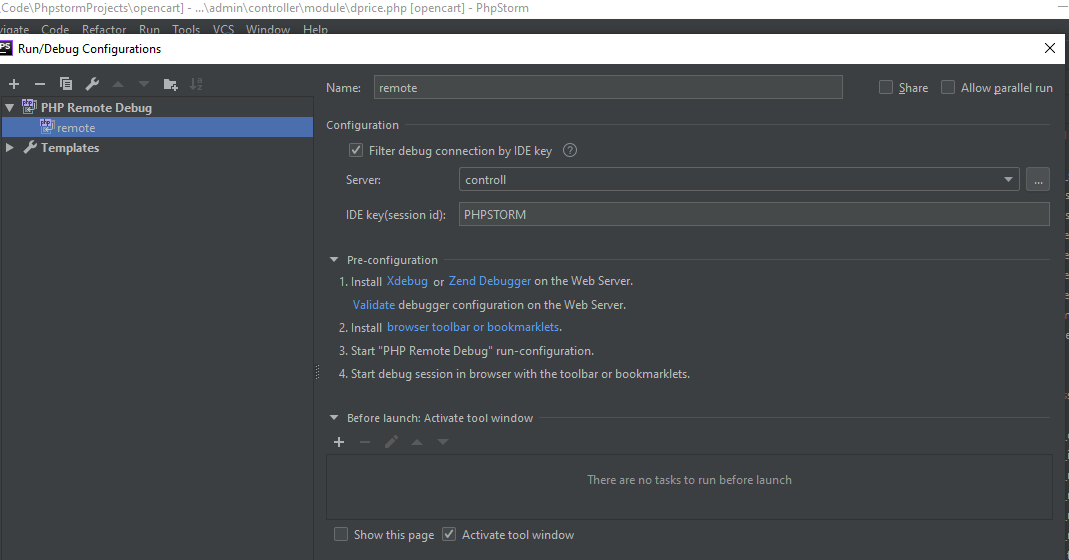
And so the essence of the question, How to configure xdebug to catch code on a remote server in phpstorm.
Prelude.
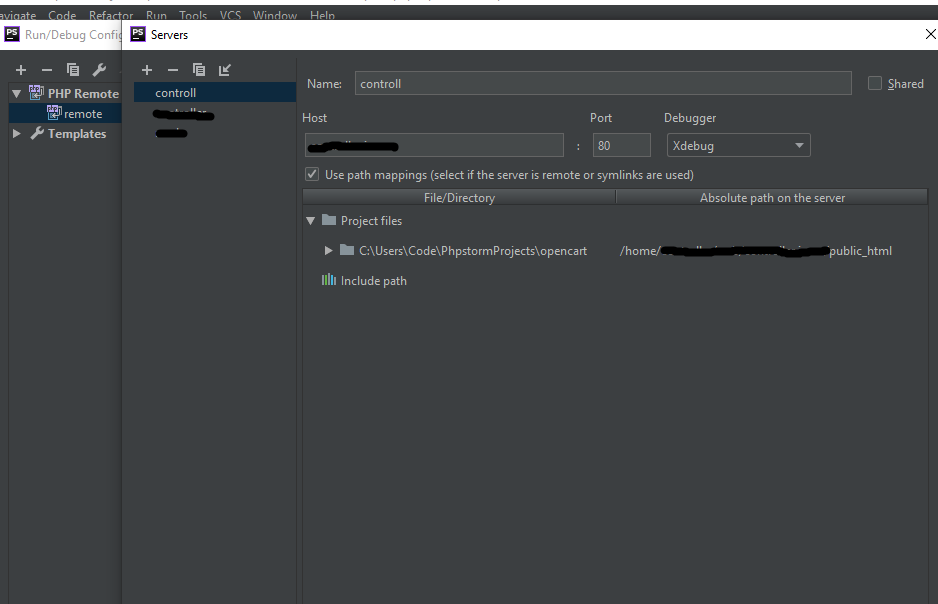
I have been quietly developing my website. I have xampp installed locally, xdebug is configured, all work is deployed from the phpstorm project to the local server, and after testing, I uploaded everything I needed to the working store with my hands.
When updating one of the modules, I encountered the fact that the module interacts with someone else's code (a module on ioncube with binding to a domain), which is not possible to enable on the local and debug the code. I decided that there is no other way out, which is to set up xdebug remotely and trace the relationship with someone else's code. And then it began, in short, I’ve been digging the Internet for a week, it doesn’t work (((.
What I did for this.
1. First, I installed xdebug on the server. Installed the extension on centos 6 yum install php-pecl-xdebug.x86_64
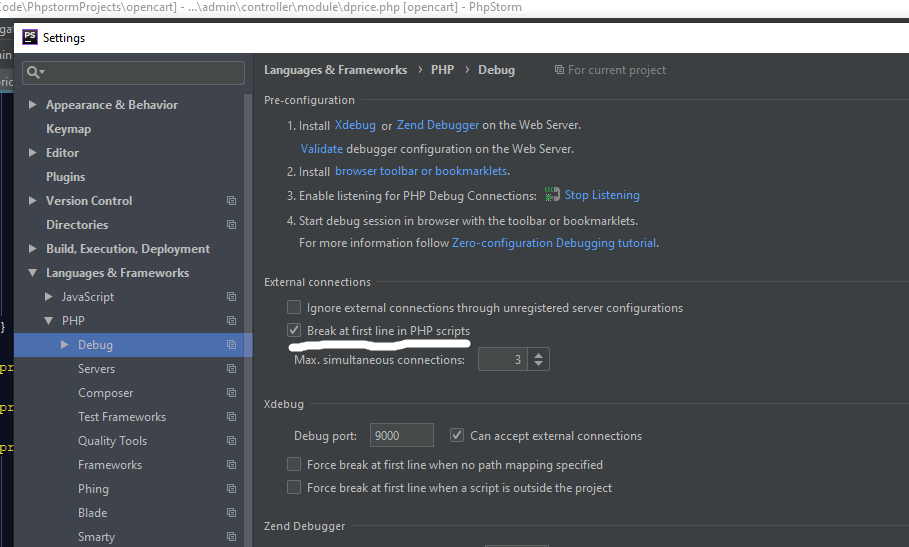
2. configured php.ini
zend_extension = /usr/local/ioncube/ioncube_loader_lin_5.6.so
zend_extension_ts = /usr/local/ioncube/ioncube_loader_lin_5.6_ts.so
zend_extension = /usr/lib64/php/modules/xdebug.so
xdebug.remote_enable = 1
xdebug.remote_host = myIP
xdebug.remote_port = 9000
xdebug.remote_handler = dbgp
xdebug.remote_connect_back = 1
xdebug.remote_autostart=on
xdebug.idekey = "PHPSTORM"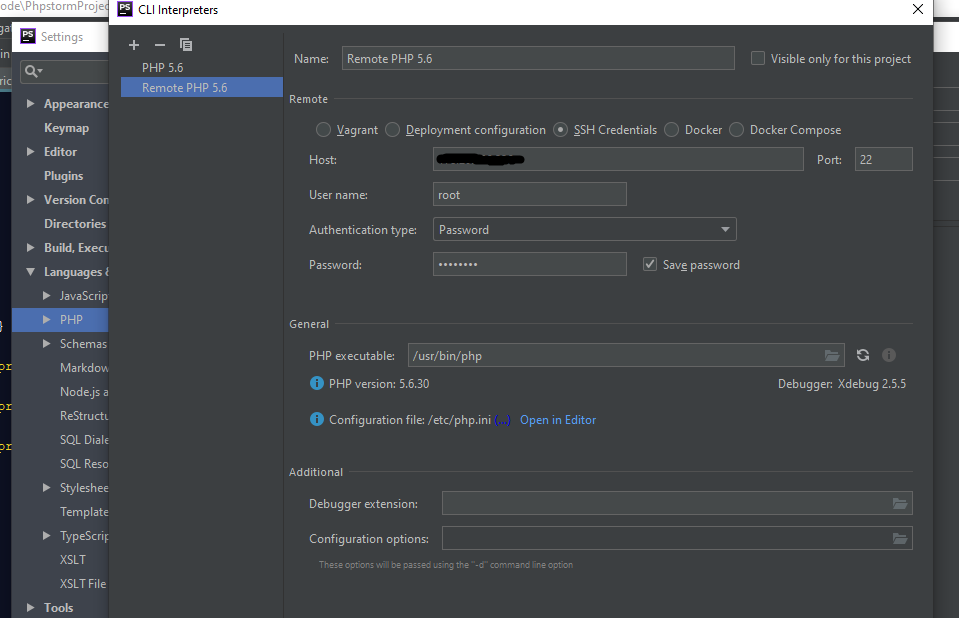
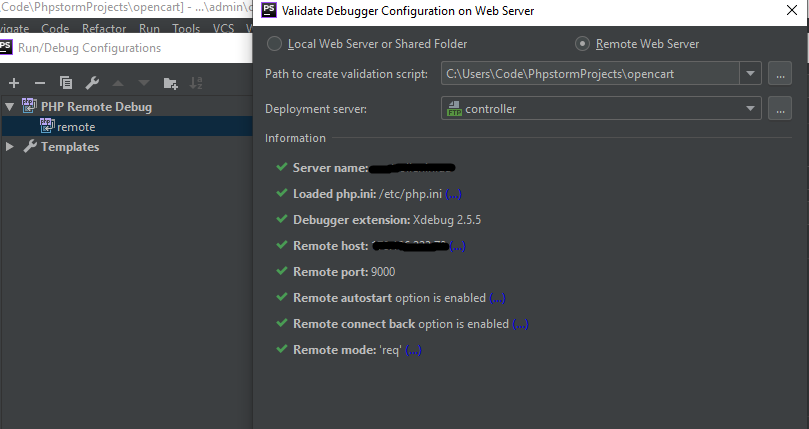
xdebug.remote_host = 127.0.0.1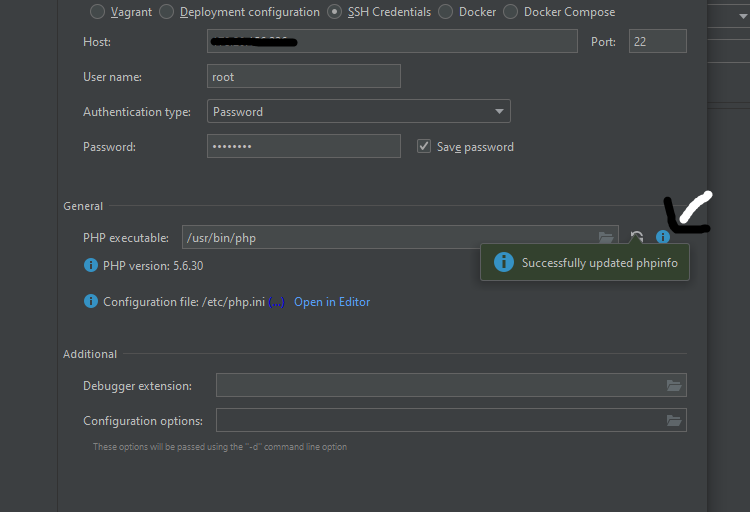
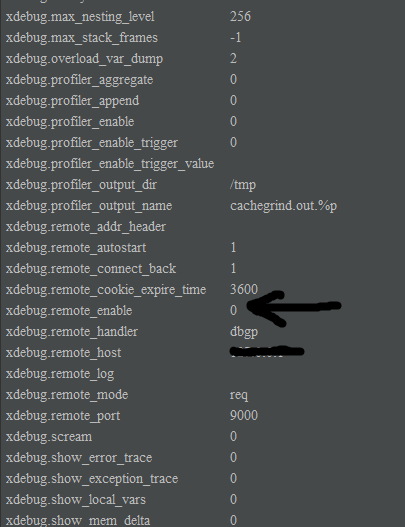
xdebug.remote_enable = 1Answer the question
In order to leave comments, you need to log in
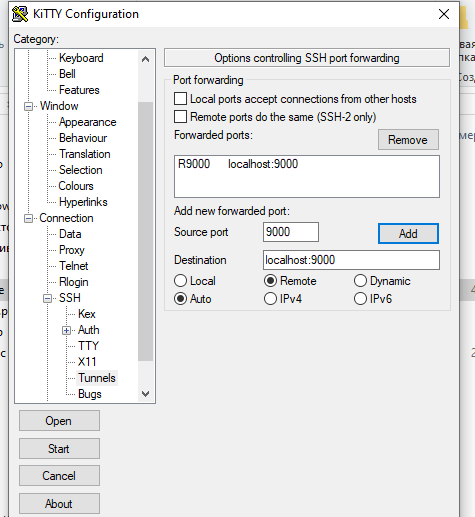
I will share, maybe it will be useful for someone. As always, everything turned out to be easier than expected. The solution is in the router, or rather, it was necessary to forward the ports needed on the router. After that, it worked, but not everything ((.
Another problem appeared. Doesn’t want to work correctly with https. Only if Break at first line is enabled. Doesn’t see breakpoints in the project. And on certain pages, the response is 500 in the browser.
As far as I understand, it’s connected with rules in .htaccess.
Didn't find what you were looking for?
Ask your questionAsk a Question
731 491 924 answers to any question