Answer the question
In order to leave comments, you need to log in
How to see the script step by step in the debugger?
How can I track the work of the script so that it shows me step by step and clearly how it works?
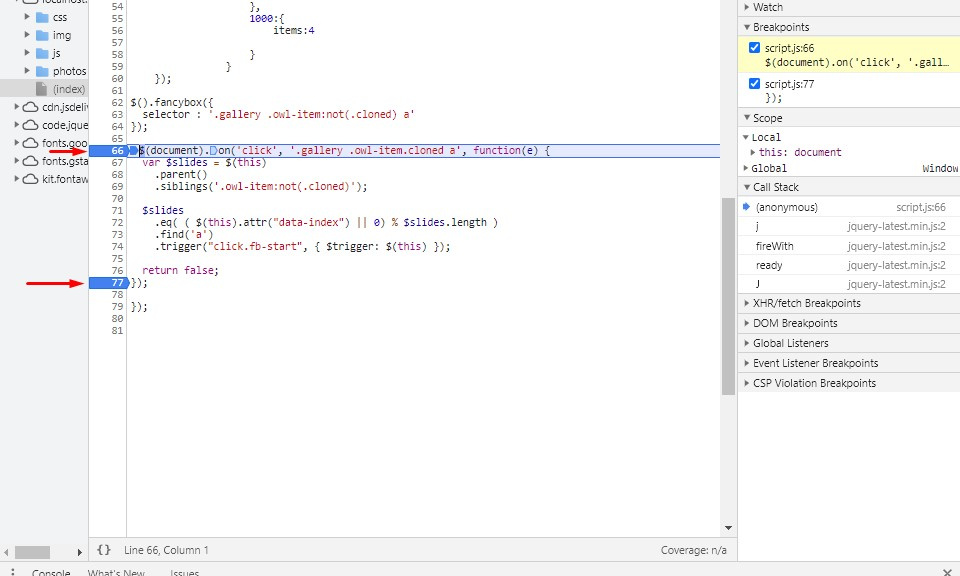
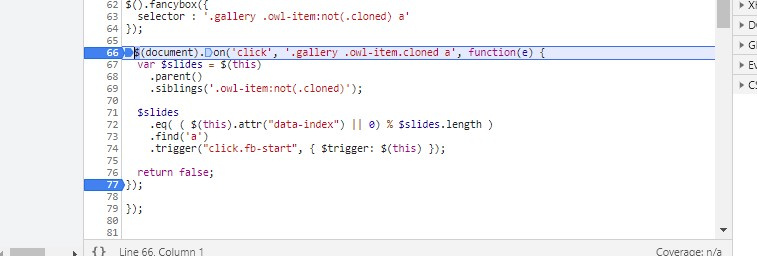
First I set breakpoints

Then I refresh the page I step through

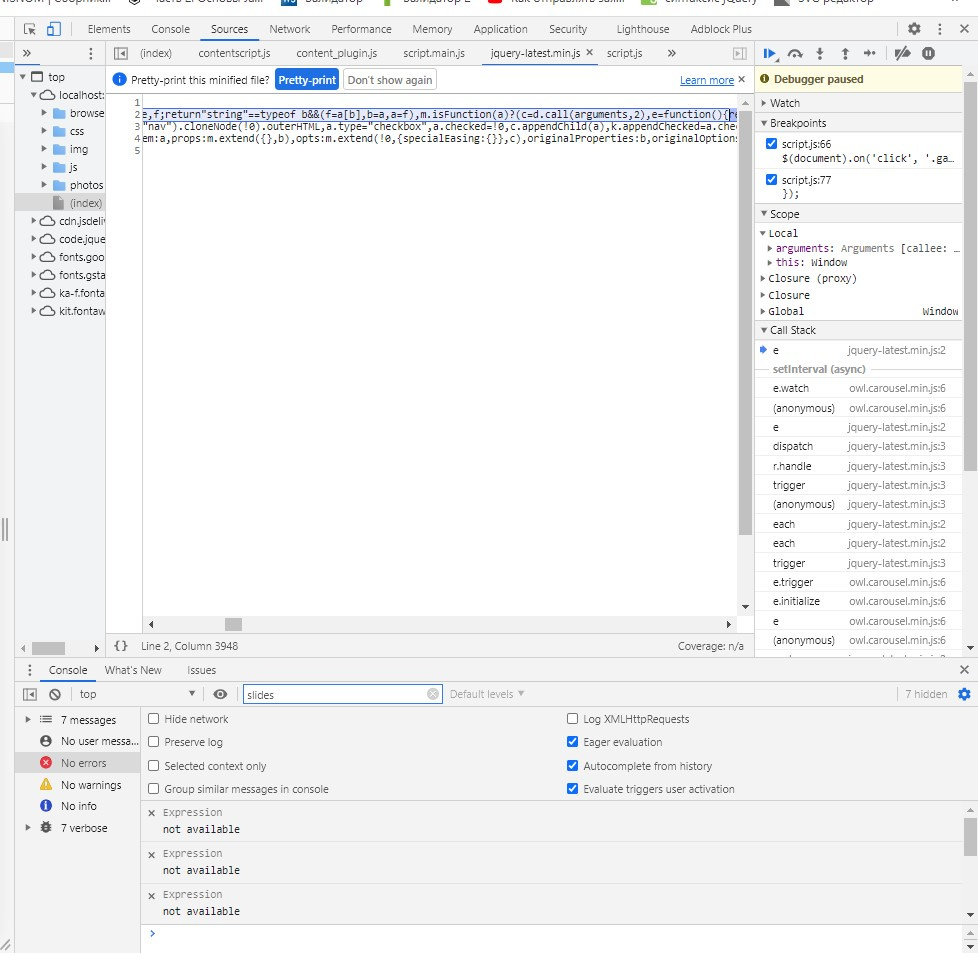
the code and then it exits into another script file? Why? I set breakpoints in one script file, and it goes into another

Answer the question
In order to leave comments, you need to log in
So you're asking JavaScript to "execute the current one and show the next command", so it jumps to the first command of the jquery.on() function, which is described in the jquery-latest.min.js file.
There, in the management console, in addition to the button "execute the current and show the next command", there is also a button "execute the entire function (without going inside), and show the command following the function" ...
PS Or put breakpoints not on the function declaration , but on commands inside it.
All debuggers usually have Step into and Step over commands, that is, "Step in" and "Step through". They differ in call handling - in the first case, the debugger will load the called module and stop at its first command, in the second case, it will execute the call without tracing and stop at the first command after the call.
The first one usually catches the entrance to a falling or not debugged procedure, the second - they bypass the already debugged ones. Apparently, you gave the first command instead of the second :)
Didn't find what you were looking for?
Ask your questionAsk a Question
731 491 924 answers to any question