Answer the question
In order to leave comments, you need to log in
How to properly process an object for HighCharts (JavaScript, EcmaScript6)?
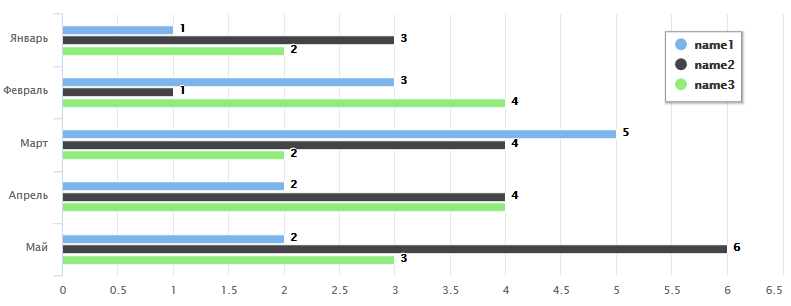
I draw a simple chart using HighCharts, you can try it here https://jsfiddle.net/j9zomL4w/
In particular, the js code is as follows:
var compare = (a, b) => {
  return a.y > b.y ? 1 : (a.y < b.y ? -1 : 0);
};
var colors = Highcharts.getOptions().colors;
var options = {
  series: [{
    data: [
    	{y: 0},{y: 2},{y: 0},{y: 4},{y: 0},{y: 0},{y: 0},{y: 3},{y: 0}
    ].filter(o => o.y) // Filter 0 values
    	.map((o, i) => {o.color = colors[i]; return o}) // Add colors
      .sort(compare), // Sort
    type: 'bar'
  }]
};
var chart = Highcharts.chart('container',options);var obj = [
{
name: "name1",
data: [1,2,3,4,5,6,7,8,9,10,11,12]
},
{
name: "name2",
data: [12,11,10,9,8,7,6,5,4,3,2,1]
}];
...
// Что-то вроде такого:
series: [{
data: obj.filter(o => o.y) // Filter 0 values
.map((o, i) => {o.color = colors[i]; return o}) // Add colors
.sort(compare), // Sort
...
Answer the question
In order to leave comments, you need to log in
Solution suggested on the Highcharts support forum:
jsfiddle
// Initial data
var data = [
  [107, 131, 635, 203, 29, 152, 954, 420, 740, 38, 42, 156],
  [133, 50, 0, 408, 6, 40, 107, 31, 635, 203, 222, 225],
  [152, 200, 420, 740, 38, 133, 156, 947, 152, 408, 6, 40]
];
var colors = Highcharts.getOptions().colors;

// Map array of numbers to array of objects with color property
var series = data.map((serieData, index) => {
  return {
    name: 'Item ' + index,
    data: serieData.map((pointData, i) => {
    	return {
      	y: pointData,
        color: colors[index]
      }
    })
  }
});

// Create rotated array
var width = series[0].data.length;
var height = series.length;
var rotated = [];
for (let i = 0; i < height; ++i) {
  for (let j = 0; j < width; ++j) {
  	rotated[j] = rotated[j] ? rotated[j] : {data: []};
  	rotated[j].data.push(series[height-i-1].data[width-j-1])
  }
}

// Sort every row of rotated array
for (let i = 0; i < width; ++i) {
  rotated[i].data.sort((a, b) => a.y < b.y ? 1 : (a.y > b.y ? -1 : 0));
}

// Rotate back and update series array
for (let i = 0; i < width; ++i) {
  for (let j = 0; j < height; ++j) {
  	series[j] = series[j] ? series[j] : {data: []};
  	series[j].data[i] = rotated[width-i-1].data[height-j-1]
  }
}

// Filter empty elements
series = series.map(seriesData => {
  seriesData.data = seriesData.data.map(pointData => !!pointData.y ? pointData : null);
  return seriesData;
});

// Options
var options = {
  chart: {
    type: 'bar'
  },
  xAxis: {
    categories: ['Jan', 'Feb', 'Mar', 'Apr', 'May', 'Jun',
      'Jul', 'Aug', 'Sep', 'Oct', 'Nov', 'Dec'
    ]
  },
  legend: {
    layout: 'vertical',
    align: 'right',
    verticalAlign: 'top',
    x: -40,
    y: 80,
    floating: true,
    borderWidth: 1,
  },
  series: series
};

// Create chart
var chart = Highcharts.chart('container', options);Try filtering each series jsfiddle.net/h5y3gddy or write a function that will return the array you need and use it when generating the graph.
Didn't find what you were looking for?
Ask your questionAsk a Question
731 491 924 answers to any question