Answer the question
In order to leave comments, you need to log in
How to plot this program in PyQt5?
How to plot this program in PyQt5?
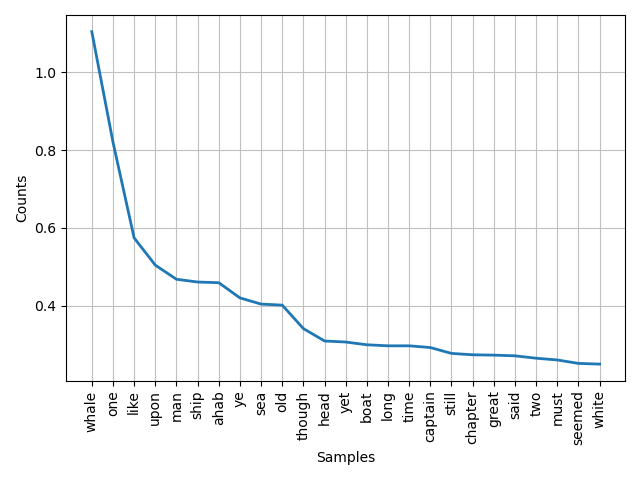
fd.plot(25) - plots the top 25 words

import requests
from bs4 import BeautifulSoup
from nltk.tokenize import RegexpTokenizer
import nltk
import io
nltk.download('stopwords')
from nltk.corpus import stopwords
import matplotlib.pyplot as plt
from stop_words import get_stop_words

r = requests.get('https://www.gutenberg.org/files/2701/2701-h/2701-h.htm')
# Извлечение HTML
html = r.text
# Создаём BeautifulSoup из HTML
soup = BeautifulSoup(html, "html5lib")

# Получаем текст

text = soup.get_text()
# Создаём tokenizer, выкидывая знаки пунктуации
tokenizer = RegexpTokenizer('\w+')

# Создаём tokens
tokens = tokenizer.tokenize(text)

# Создаем новый list
words = []

# Перебираем список

for word in tokens:
    words.append(word.lower())

# Получаем английские стоп-слова и выводим некоторые из них
sw = nltk.corpus.stopwords.words('english')
with io.open("STOP_EN.TXT", "r", encoding='utf-8') as myfile:
    data = myfile.read().splitlines()
sw.extend(data)
data2 = get_stop_words('en')
sw.extend(data2)
# Создаем новый list
words_ns = []

for word in words:
    if word not in sw:
        words_ns.append(word)

# создаем график плотности ключевых слов
fd = nltk.FreqDist(words_ns)
total = fd.N()
for wordo in fd:
    fd[wordo] /= float(total)/100
fd.plot(25)Answer the question
In order to leave comments, you need to log in
I figured out how to save the image, but pyplot could not cancel the display)
import sys
from PyQt5.QtWidgets import QWidget, QLabel
from PyQt5.QtGui import QPixmap
from PyQt5.QtWidgets import QApplication


import requests
from bs4 import BeautifulSoup
from nltk.tokenize import RegexpTokenizer
import nltk
import io
nltk.download('stopwords')
from nltk.corpus import stopwords
import matplotlib.pyplot as pyplot
from stop_words import get_stop_words

r = requests.get('https://www.gutenberg.org/files/2701/2701-h/2701-h.htm')
# Извлечение HTML
html = r.text
# Создаём BeautifulSoup из HTML
soup = BeautifulSoup(html, "html5lib")

# Получаем текст

text = soup.get_text()
# Создаём tokenizer, выкидывая знаки пунктуации
tokenizer = RegexpTokenizer('\w+')

# Создаём tokens
tokens = tokenizer.tokenize(text)

# Создаем новый list
words = []

# Перебираем список

for word in tokens:
    words.append(word.lower())

# Получаем английские стоп-слова и выводим некоторые из них
sw = nltk.corpus.stopwords.words('english')
with io.open("STOP_EN.txt", "r", encoding='utf-8') as myfile:
    data = myfile.read().splitlines()
sw.extend(data)
data2 = get_stop_words('en')
sw.extend(data2)
# Создаем новый list
words_ns = []

for word in words:
    if word not in sw:
        words_ns.append(word)

# создаем график плотности ключевых слов
fd = nltk.FreqDist(words_ns)
total = fd.N()
for wordo in fd:
    fd[wordo] /= float(total)/100

fd.plot(25)
pyplot.savefig("image.png")


class ImageViewer(QWidget):
    def __init__(self):
        super().__init__()

        image_label = QLabel(self)
        pixmap = QPixmap("image.png")
        image_label.setPixmap(pixmap)

        self.resize(pixmap.width(), pixmap.height())  # fit window to the image
        self.setWindowTitle('График функции')


def main():
    app = QApplication(sys.argv)
    image_viewer = ImageViewer()
    image_viewer.show()
    sys.exit(app.exec_())

if __name__ == '__main__':
main()Didn't find what you were looking for?
Ask your questionAsk a Question
731 491 924 answers to any question