Answer the question
In order to leave comments, you need to log in
How to plot a function graph with sine, logarithm and integral in Matlab?
Hi all! You can't do this in LaTeX, and in Matlab I don't understand anything at all.
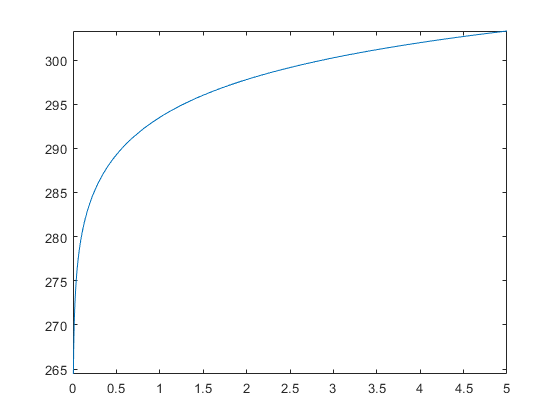
It is necessary to build a graph (photo below), but the complexity of the function becomes an obstacle for me. How can i do this?

Here c = 299792.458, Ωm = 0.3, ΩΛ = 0.7. Thanks for the tips and help.
Answer the question
In order to leave comments, you need to log in
You can use the symbolic calculation package (Symbolic toolbox):
c = 299792.458;
Omega_m = .3;
Omega_lam = .7;
H = 2.2e-18;

syms z
f = 5 * log(c * H^(-1) * (1+z) *...
    int((...
        (1+z)^2 * (1+Omega_m*z) - z*(2+z)*Omega_lam...
        )^(-1/2), [0, z]) )+ 25;

fplot(f, [0 5])
Didn't find what you were looking for?
Ask your questionAsk a Question
731 491 924 answers to any question