Answer the question
In order to leave comments, you need to log in
How to merge two charts in Chart.js?
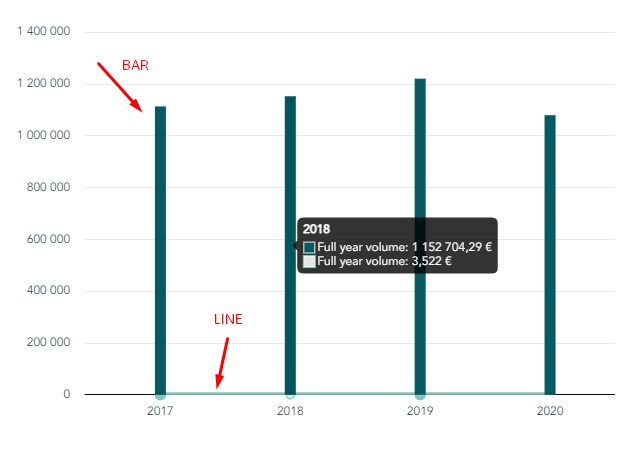
Good afternoon, there are two objects in datasets, each in data has the same amount of data. Some data needs to be displayed in Bar, others - in Line. But for one value, measured in tens and hundreds of thousands, and for the other - mostly units, maximum - tens. Those. the usual mixed chart from the documentation provides not quite the desired functionality. Since both charts have the same scale, it turns out that the line chart with its miserable units stupidly stretches as a solid line at the very bottom of the chart, because. tied to a scale with hundreds of thousands. It looks like this:
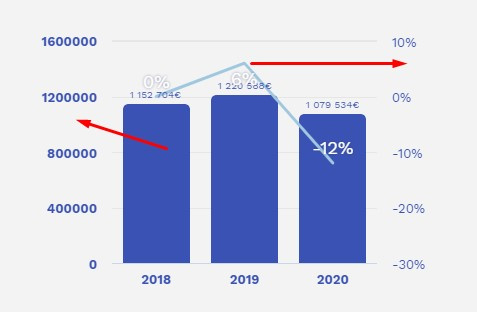
And it should be like this, with two y-axes, each for its own type of chart:
Since the application is made on vue, I will be especially grateful for a hint on how to do this in the vue context.
Answer the question
In order to leave comments, you need to log in
We need to define two Y-axes:
options: {
  scales: {
    yAxes: [
      { id: 'y1', position: 'left' },
      { id: 'y2', position: 'right' },
    ],
  },
},
application is made on vue
What is the best way to set a fixed width for the form or elements?
Didn't find what you were looking for?
Ask your questionAsk a Question
731 491 924 answers to any question