Answer the question
In order to leave comments, you need to log in
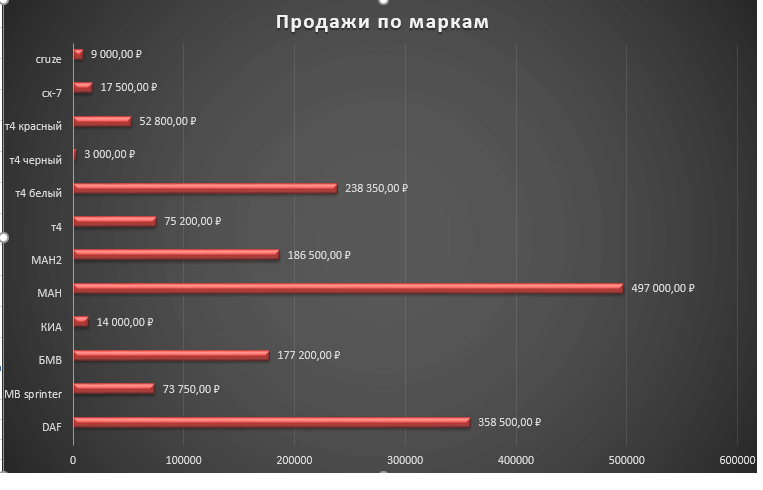
How to make this chart in Excel?
Здравствуйте, имеется такая таблица данных
DAF 358 500,00 ₽
MB sprinter 73 750,00 ₽
БМВ 177 200,00 ₽
КИА 14 000,00 ₽
МАН 497 000,00 ₽
МАН2 186 500,00 ₽
т4 75 200,00 ₽
т4 белый 238 350,00 ₽
т4 черный 3 000,00 ₽
т4 красный 52 800,00 ₽
cx-7 17 500,00 ₽
cruze 9 000,00 ₽
делаю диаграмму, как на скрине
у каждой марки имеется себестоимость, как сделать, что бы на диаграмме указывалась себестоимость, например
DAF 358 500,00 ₽ /500 000, 00 р <- это себестоимость. И что бы отображалось на диаграмме в таком виде, плюс в скобках писалось на сколько продано процентов от себестоимости.
Реально ли такое вообще сделать ?
Answer the question
In order to leave comments, you need to log in
Clause 1 It is necessary to create a separate column where this will be formed: "DAF 358,500.00 ₽ / 500,000.00 r" along with a change in percentage. You have to do this, the diagram itself will not do it.
p.2 It is necessary to right-click on any of the data labels (signatures in rubles near the stripes) and select "Format of data labels". There uncheck "Value" and put "Values from cells". Then click "Select range" and specify the column created in step 1.
Hmmm... The usual bar chart. Click the add chart button and it will be there in the list of charts. Why even ask without even trying to do something?
Didn't find what you were looking for?
Ask your questionAsk a Question
731 491 924 answers to any question