Answer the question
In order to leave comments, you need to log in
How to make the correct display of graphs in Libre office?
I made myself a statistics collection document. But in my charts, the date is displayed only from the beginning of the chart. How can I make the date appear at least through the grid line? Libre office document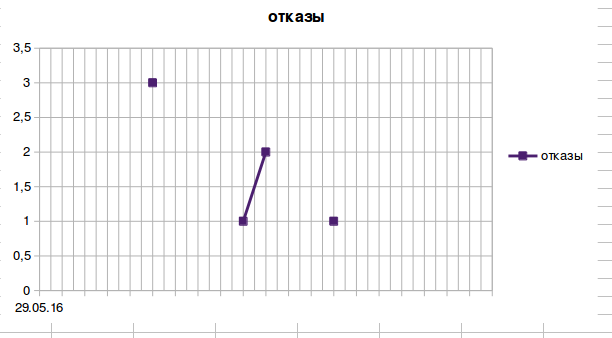
Answer the question
In order to leave comments, you need to log in
Didn't find what you were looking for?
Ask your questionAsk a Question
731 491 924 answers to any question