Answer the question
In order to leave comments, you need to log in
How to make donut chart using svg?
How to implement such a circle so that its coloring can be easily changed, that is, more / less than orange or blue?
Is this only on svg ?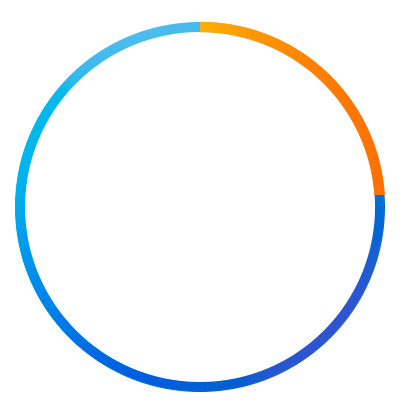
Answer the question
In order to leave comments, you need to log in
Here is a good article on this topic:
https://devacademy.ru/article/krugovaia-i-koltseva...
Didn't find what you were looking for?
Ask your questionAsk a Question
731 491 924 answers to any question