Answer the question
In order to leave comments, you need to log in
How to make a secondary pie chart (with callout) in Google Charts?
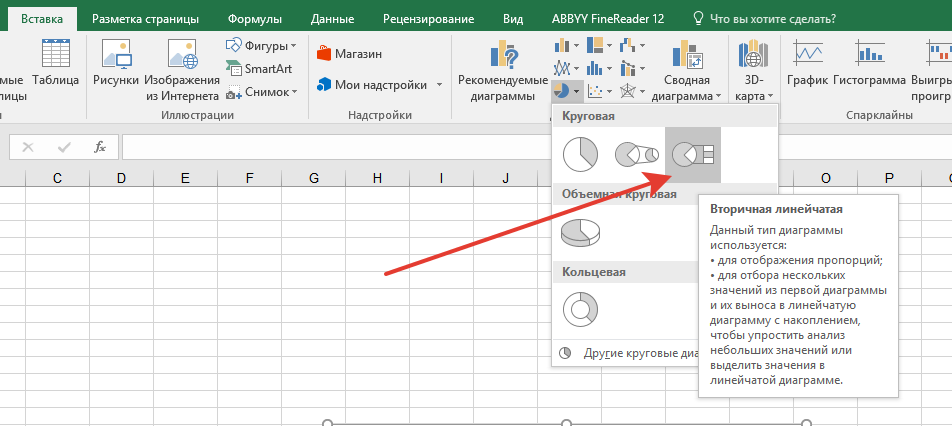
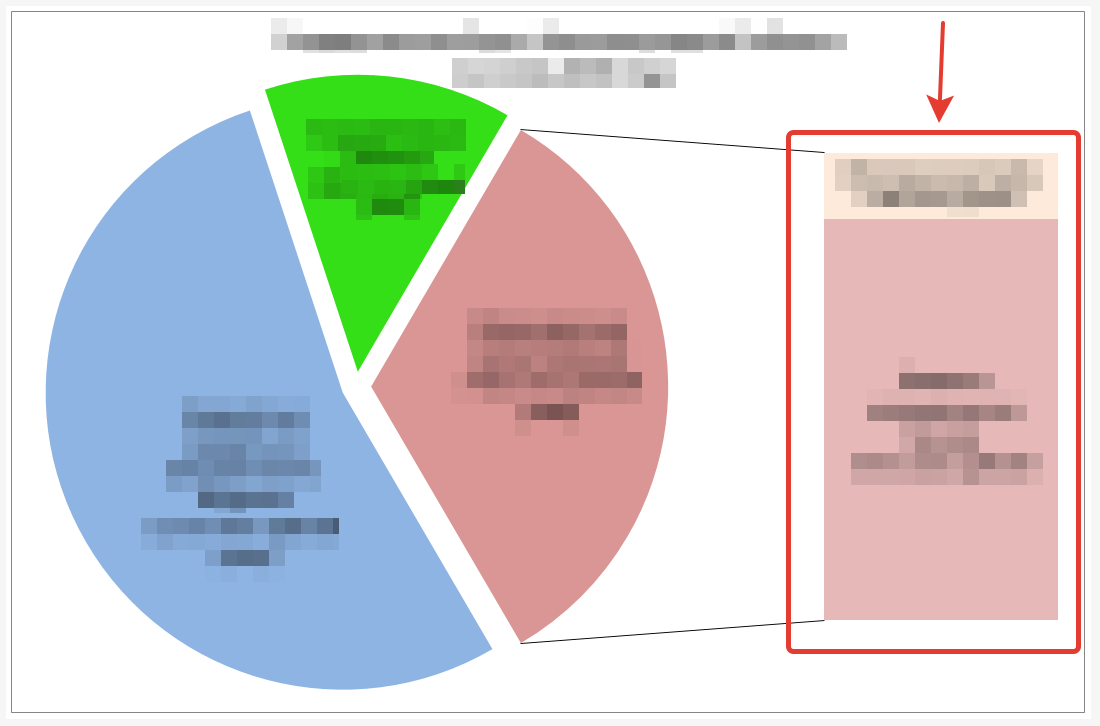
There is a chart in Excel, it's called "Secondary Bar Chart" or "Callout Chart". It looks like a regular circular one, in which one of the values is rendered in detail (see screenshot). 

You need to do the same in Google Charts for integration on the site.
Is it possible through Google Charts?
If not, what analogue can be used to implement this on the site?
Answer the question
In order to leave comments, you need to log in
Didn't find what you were looking for?
Ask your questionAsk a Question
731 491 924 answers to any question