Answer the question
In order to leave comments, you need to log in
How to make a diagram-graph on the site?
Hello!
I am new to the web. Tell me, please, how difficult is it to implement the functionality described below, what technologies should be used, and how is it better to do it in general? What to read, watch on this topic?
Functional:
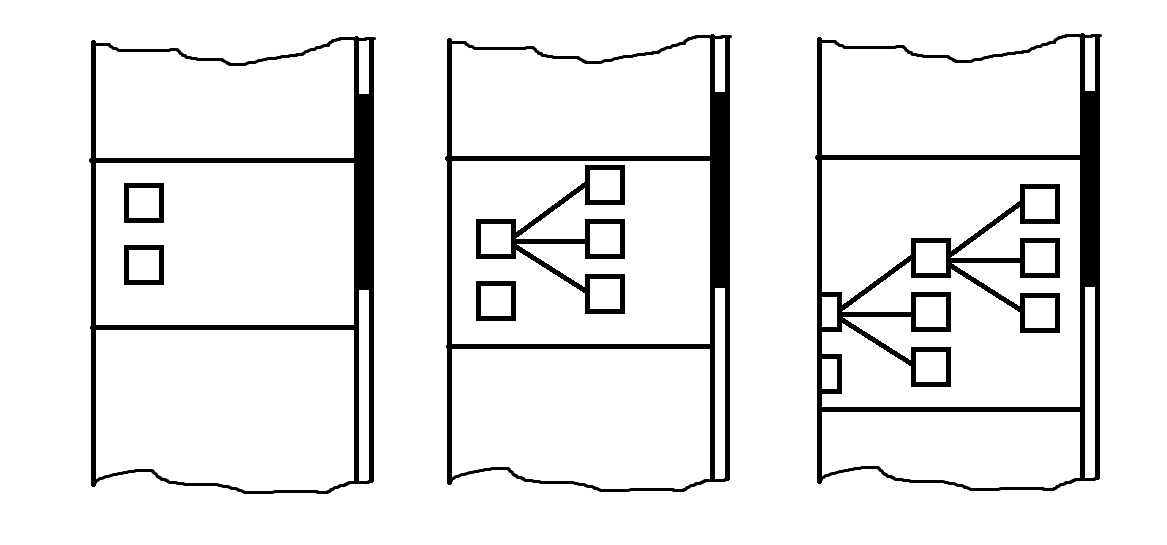
There is a section of the site in which there are pictures (squares), other html elements can also be located in the section. Squares can also contain captions and other related elements. If you click on a square, then from 0 to 10 new squares are drawn to the right of it. They are connected to the previous square with lines. New squares can also be clicked on and added to the next set of squares. The section automatically expands vertically, horizontally it can be scrolled left and right as needed. The content of the squares and the number of new squares are calculated on the server.
Answer the question
In order to leave comments, you need to log in
Go to the gallery there are ready-made options
https://d3js.org/
this is drawn in HTML canvas
, you can look for some libraries, but everything is pretty primitive here, I would draw without them.
https://js.cytoscape.org/
Just designed for drawing graphs. You can also change the appearance of nodes (circles, squares, something more complex, etc.), links are drawn, clicks are processed, and more. other.
You can also draw on Canvas yourself. Simple drawing is not difficult, but you will have to bother a lot with scaling, scrolling, etc. If you practice, then you can, but if you are interested in a quick result, then it is better to use the library.
Didn't find what you were looking for?
Ask your questionAsk a Question
731 491 924 answers to any question