Answer the question
In order to leave comments, you need to log in
How to install zabbix on ubuntu 18.04.1?
Hello. I'm trying to install a zabbix server on Ubuntu 18.04.1. Both 3.4 and 4.0. According to the official instructions, and a little Google. I stumbled upon this:
apt install zabbix-release zabbix-server-mysql zabbix-frontend-php
Reading package lists... Done
Building dependency tree
Reading state information... Done
zabbix-release is already the newest version (3.4-1+bionic).
Some packages could not be installed. This may mean that you have
requested an impossible situation or if you are using the unstable
distribution that some required packages have not yet been created
or been moved out of Incoming.
The following information may help to resolve the situation:

The following packages have unmet dependencies:
 zabbix-frontend-php : Depends: ttf-dejavu-core but it is not installable or
                                ttf-japanese-gothic but it is not installable
                       Depends: php-mbstring but it is not installable
                       Depends: php-bcmath but it is not installable
 zabbix-server-mysql : Depends: libiksemel3 (>= 1.2) but it is not installable
                       Depends: libssh2-1 (>= 1.0) but it is not installable
                       Depends: fping but it is not installable
                       Recommends: virtual-mysql-server
                       Recommends: snmpd but it is not going to be installed
E: Unable to correct problems, you have held broken packages.Answer the question
In order to leave comments, you need to log in
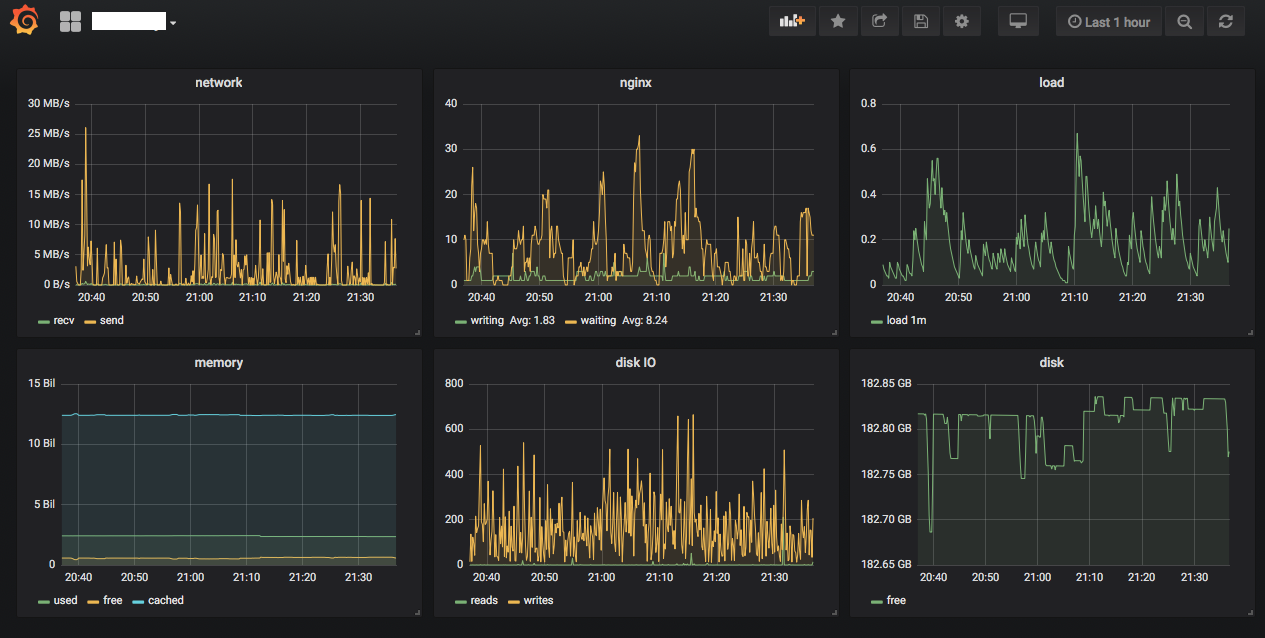
Wow, why zabbix?! Take influxdb + grafana for storage and display, telegraf and or collectd for data collection, and kapacitor for processing alerts.
And so, influxdb + telegraf + kapacitor are taken from https://www.influxdata.com
Grafana from https://grafana.com
1) Install influxdb + grafana on the monitoring server
2) telegraf - on servers to collect data from devices and themselves servers (you can also collect through collectd)
3) install kapacitor and set up alerts and alarms, and send them back to influxdb when triggered (as well as to telegrams, email and anywhere!)
4) create the necessary dashboards in grafana, there are not only charts , as well as tables.
All! At the same time, a new device or server is automatically picked up from me. Setting up and installing two or three times easier than zabbix!
Here without tables
sudo apt-add-repository universe
Then you start installing.
Didn't find what you were looking for?
Ask your questionAsk a Question
731 491 924 answers to any question