Answer the question
In order to leave comments, you need to log in
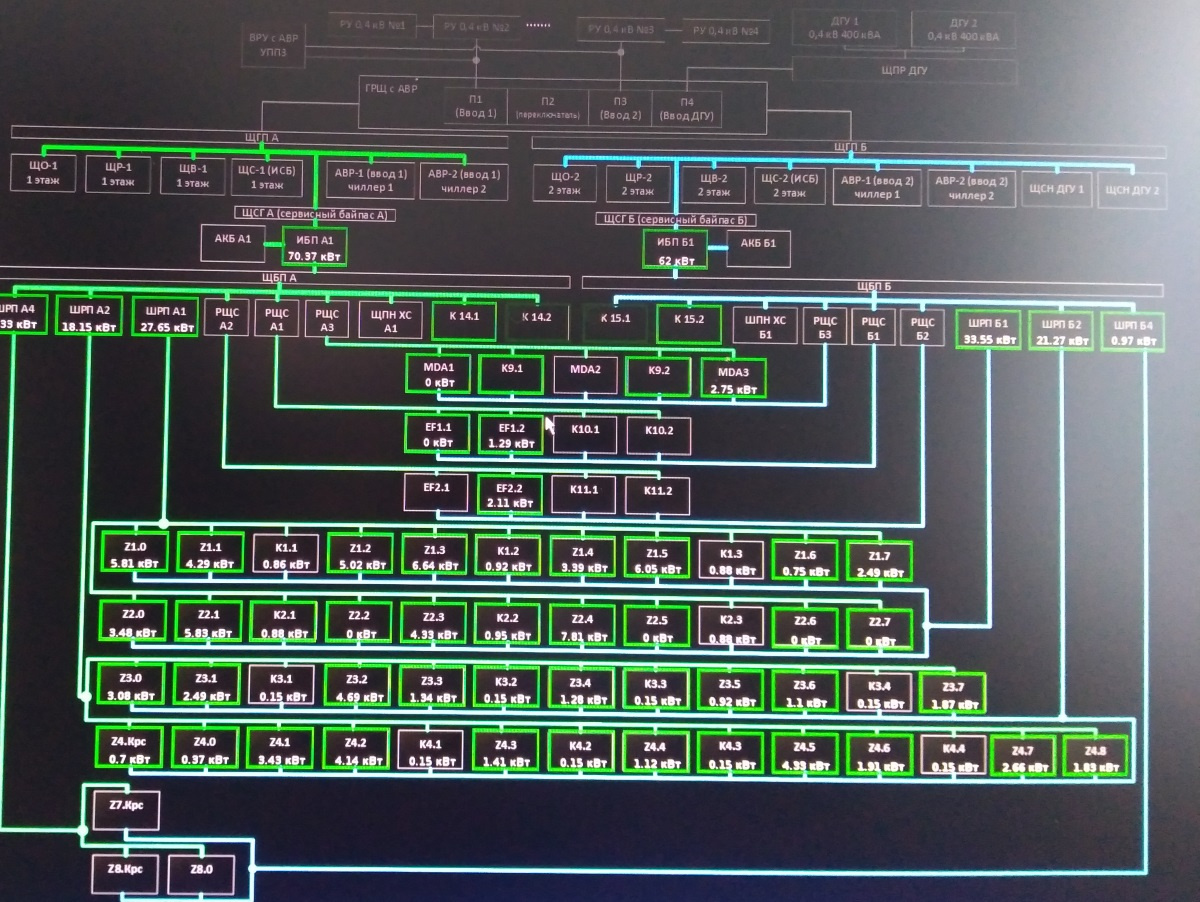
How to implement such a screen in zabbix?

Zabbix monitors the status of PDUs in racks and displays this status in a beautiful way on one of the screens. Tell me, please, in which direction to dig? Apparently this is html, values are inserted in certain places.
Answer the question
In order to leave comments, you need to log in
I kind of found how to do it through the screens. I'll post when I have time to finish.
Looks quite standard for zabbix, rectangles and lines. In zabbix, you can upload your own images and use them as a background, data elements, or just as a picture (most likely this is how the intersections are made). If the data element is made a trigger, then for each state you can load its own separate picture. Values can be displayed in the label to the element. In a recent update, they added support for gif animation, so now it can flash.
If you don’t do it with zabbix tools, then you collect data through api and then for as long as you have enough imagination and perseverance, it is well documented.
As I understand it, this is just a map (map) is done with the mouse in the standard zabbix 4 interface
Didn't find what you were looking for?
Ask your questionAsk a Question
731 491 924 answers to any question