Answer the question
In order to leave comments, you need to log in
How to implement countdowns on the balance of funds in the form of a graph?
Good day to all.
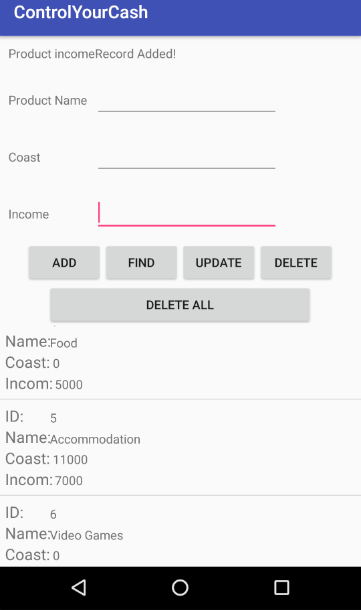
I have a DB where the user enters data on monthly income and expenses for each type of expense/income. 
(That is, for each type of "product", the user enters expenses and income for the month. Let's say that the user is studying under a contract and is also engaged in tutoring, hence Accommodation income: 7000 and coast:11000)
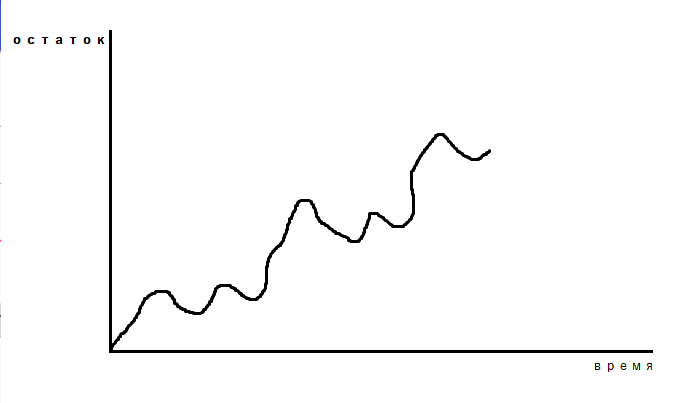
And I need to make a countdown in the form of a graph.
And the schedule itself must be done exactly according to the balance of funds ( coast - income ), i.e. something like this: 
For this, as I understand it, you need to use GraphView:
...
 <com.jjoe64.graphview.GraphView
        android:id="@+id/graphF"
        android:layout_width="match_parent"
        android:layout_height="match_parent" />
...
public class GraphicsFunctionActivity extends AppCompatActivity {
private LineGraphSeries<DataPoint> lineGraphSeries;
private GraphView graphView;
private double globalRemainder = 0;
private double coast = 0, income = 0, time = 0; // Система координат (x;y), где x - это прибыль coast - income, y - время
@Override
protected void onCreate(Bundle savedInstanceState) {
super.onCreate(savedInstanceState);
setContentView(R.layout.activity_graphics_function);
graphView = (GraphView) findViewById(R.id.graphF);
lineGraphSeries = new LineGraphSeries<DataPoint>();
update();
}
private void update() {
// ?
}
}
}int remainder += coast - income). But I don't know how best to do it.
Answer the question
In order to leave comments, you need to log in
Didn't find what you were looking for?
Ask your questionAsk a Question
731 491 924 answers to any question