Answer the question
In order to leave comments, you need to log in
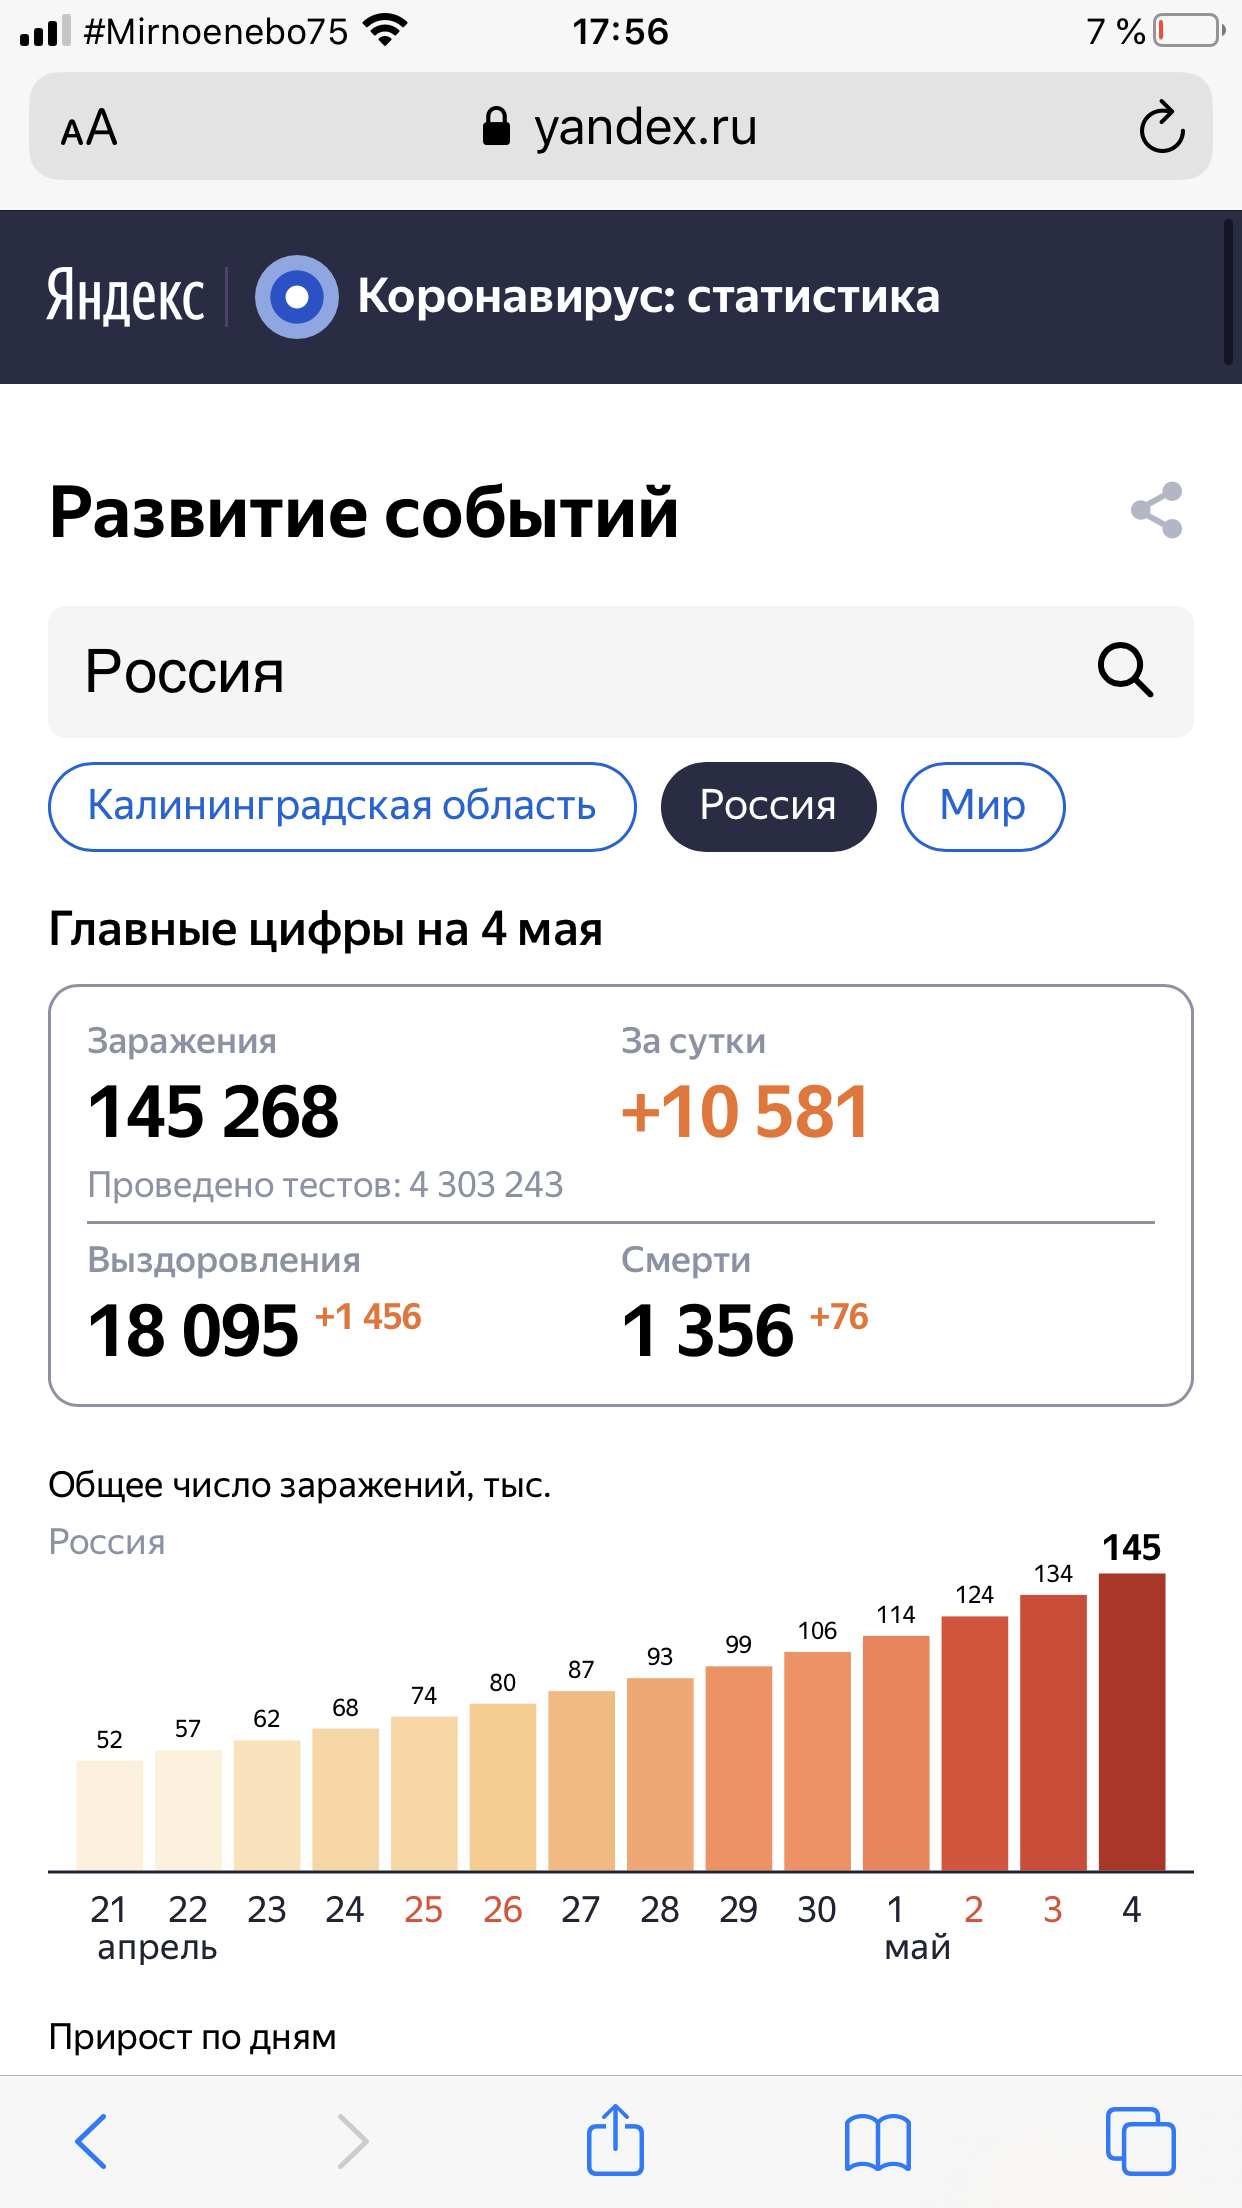
How to implement a graph of the growth of coronavirus cases like Yandex?
Hello guys!
Tell me how to implement similar coronavirus charts as in Yandex? In the same way that the information is updated daily. I didn’t find any sensible widgets with graphs, should I use special JS libraries? Can you advise which ones, and so that you can set up automatic import of data from the source?

Answer the question
In order to leave comments, you need to log in
Didn't find what you were looking for?
Ask your questionAsk a Question
731 491 924 answers to any question