Answer the question
In order to leave comments, you need to log in
How to fix axis position in Recharts chart?
Change has a graph that visualizes data by day.
Chart type: AreaChart, library: Recharts ( recharts.org/en-US/examples/StackedAreaChart)
Problem:
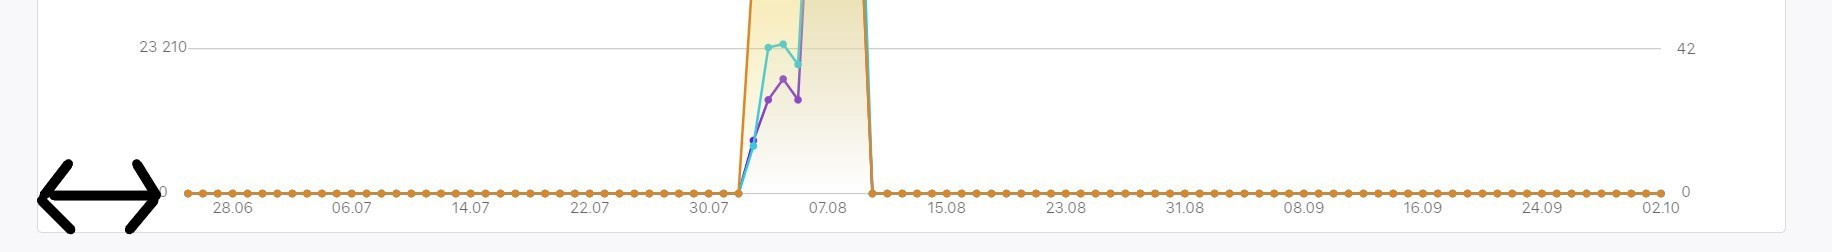
When changing the parameters by which the chart is drawn, the chart itself is redrawn and the position of the X axis changes slightly. Changing the position of the axis looks very poor, as if the layout of the entire widget is broken.
(The position of the axis changes because dates are attached to it, and I change the period).
Is there some way to fix the axis itself so that the axis line doesn't jump?
Let "ticks" change on the axis as they want, this is natural behavior, but the jumping axis looks like a breaking layout.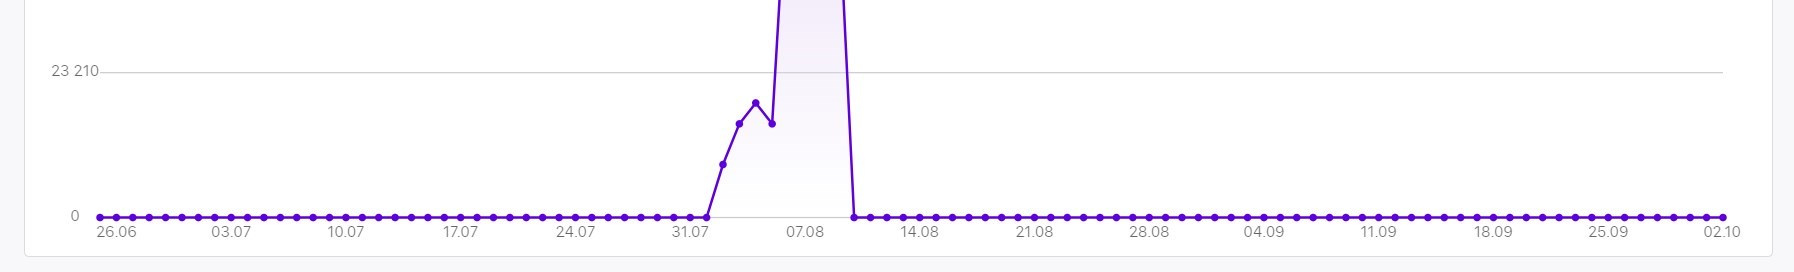
Answer the question
In order to leave comments, you need to log in
Didn't find what you were looking for?
Ask your questionAsk a Question
731 491 924 answers to any question