Answer the question
In order to leave comments, you need to log in
How to find memory leak using google chrome?
Good day!
Actually, subject.
I have something like a single page on jquery (this happened historically), which often receives information in xml, parses it using jquery and does something important with it further))
Over time (half a day or a day), the gui begins to slow down .. .From this I conclude that something is leaking)
But I don’t know how to use the development tool to catch the place (or places) of the leak.
All tutorials are mostly 2 years old or more, and chrome does not stand still and cuts something all the time.
I tried to make cuts of the hip from time to time. Memory takes more than half a megabyte-megabyte in 20-30 minutes. It even gives me a sign and tells me what and how much it takes, but I can’t figure out how to find what I need among such a huge bundle of information (and to be honest, I don’t even know what to look for there ... as an example - a screen of a random wiki article 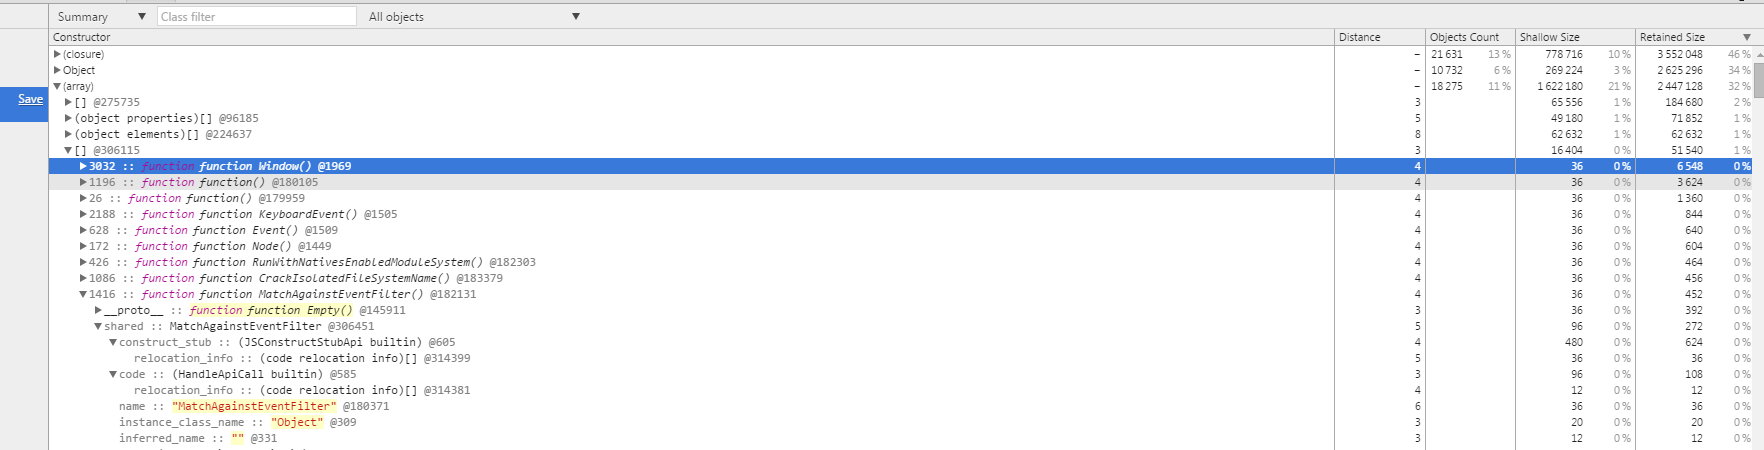 A bunch of all and try to understand which of them is which)
I would be grateful for advice and / or useful links (:
Thank you for your time!
UDP: may be relevant:
1. In the task manager of chromium, JS memory (in real time) 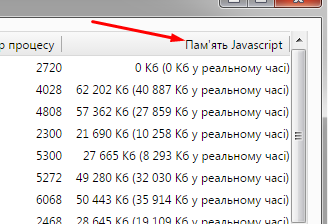 is cleaned regularly quite well. What means the value before the brackets and why it is always quite rather big, I do not know yet.
2. A bunch of things are written to the console all the time through console.log (something like logging user actions)
Answer the question
In order to leave comments, you need to log in
Didn't find what you were looking for?
Ask your questionAsk a Question
731 491 924 answers to any question