Answer the question
In order to leave comments, you need to log in
How to find an invisible process consuming a lot of memory?
There is a server. 12 CPU cores, 128Gb RAM. Uptime for almost a year.
Somewhere around 50 GB is occupied by an unknown process. In top, it is not visible who could occupy such an amount of memory (in fact, all processes have 0.0% each). On the server, the biggest memory consumers are postgres and redis. Haven't tried restarting the server. After restarting the server, nothing has changed significantly.
What it looked like with postgres and redis stopped: 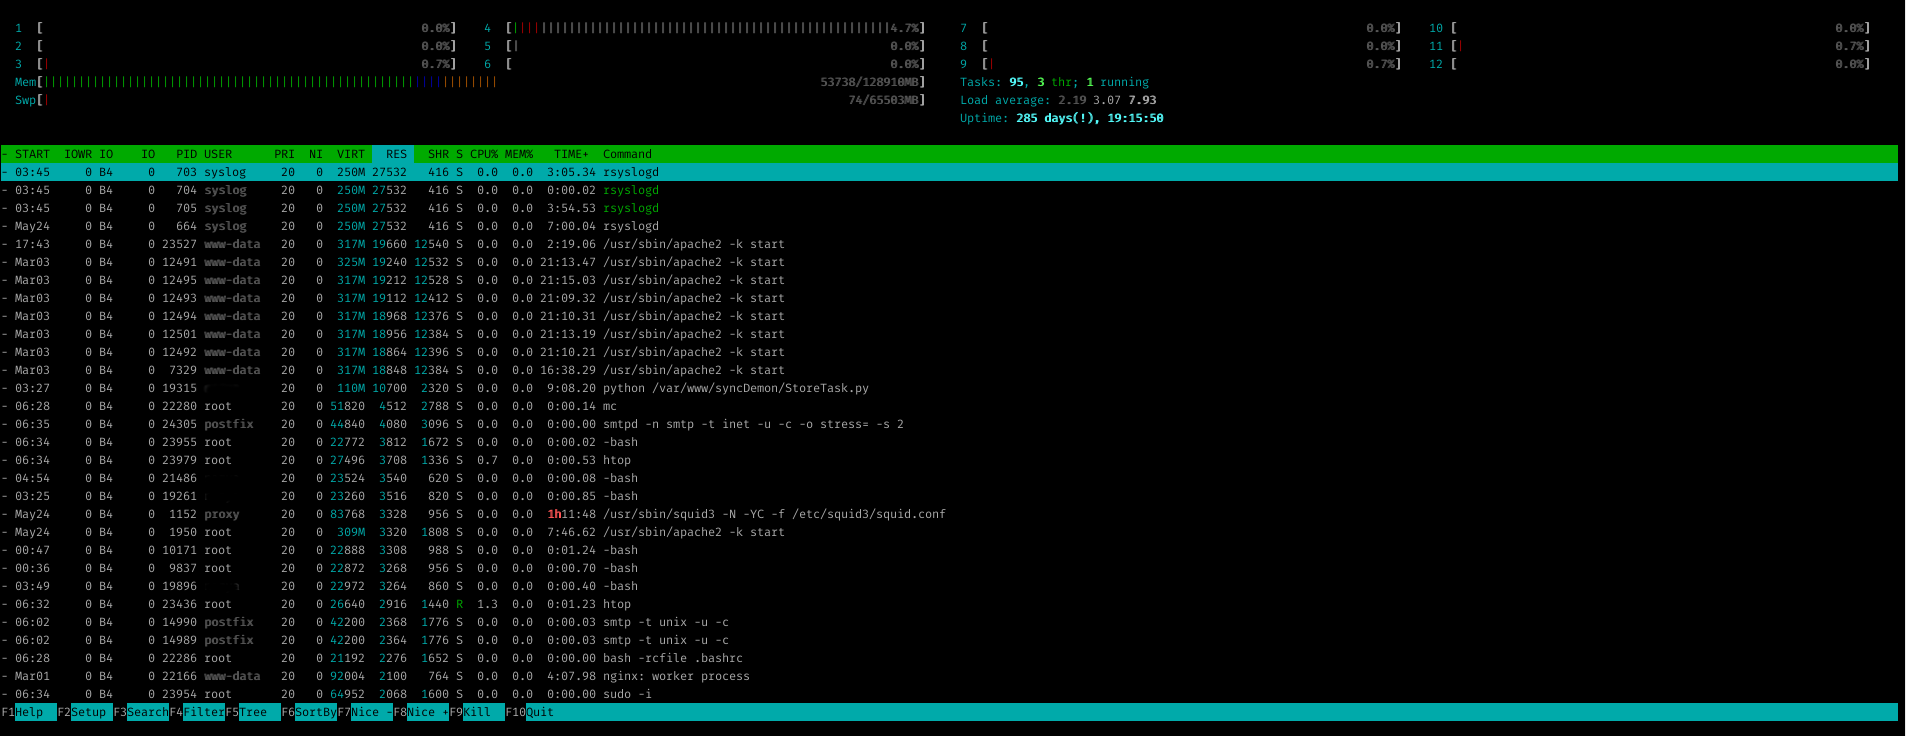
After restarting with postgres and redis stopped: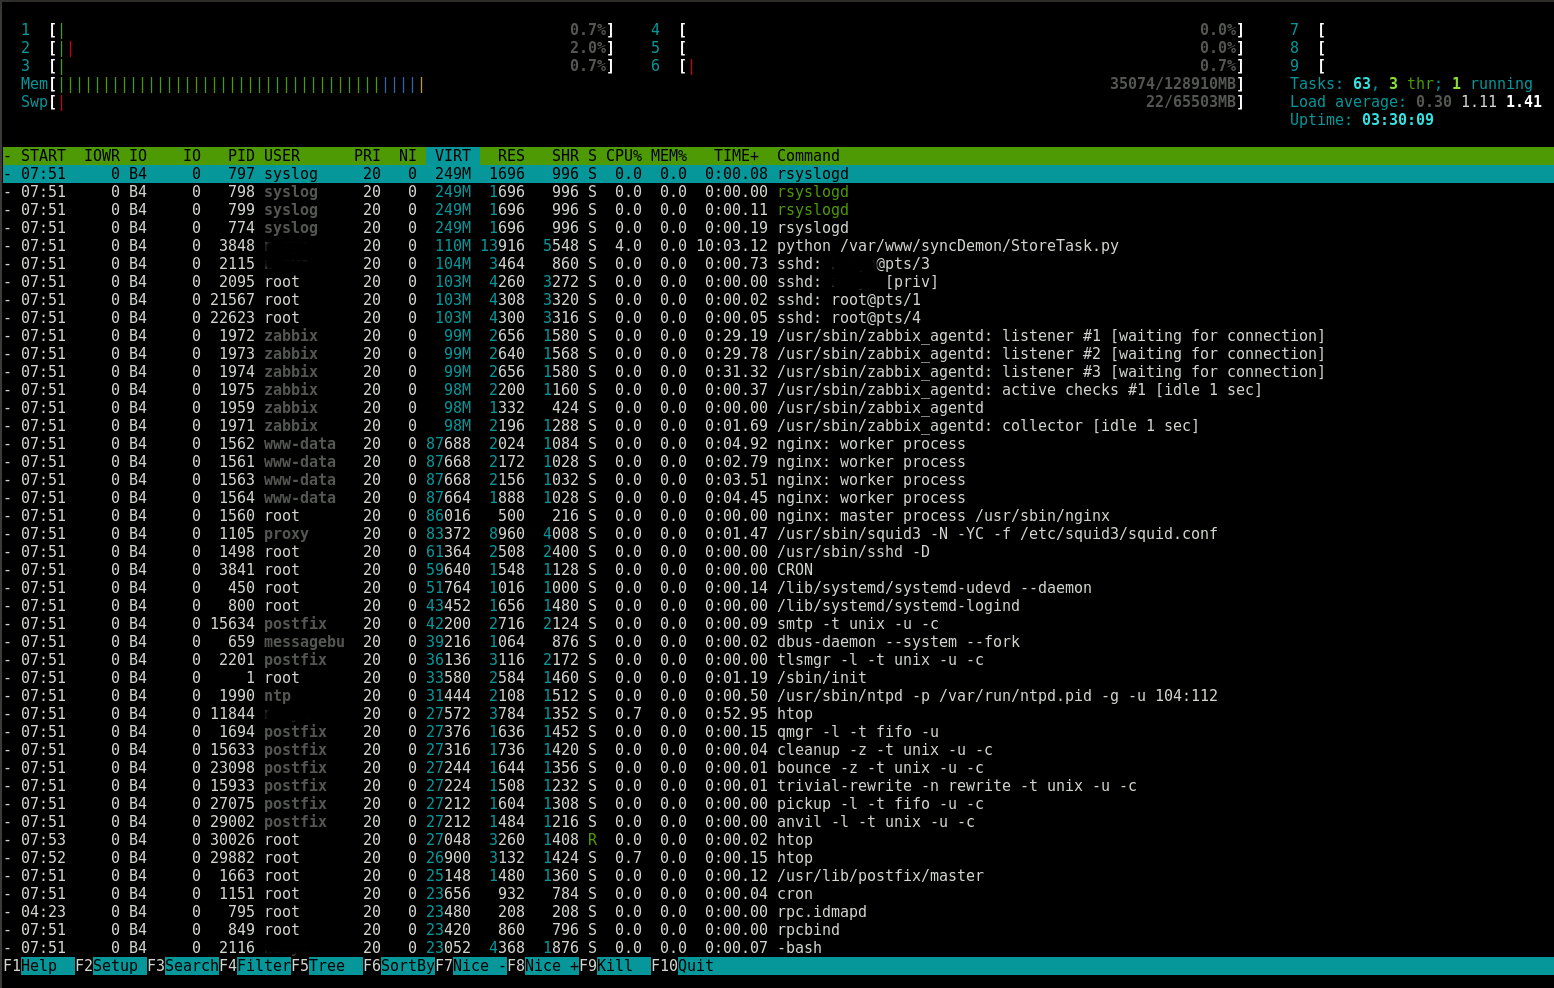
# lsb_release -a
No LSB modules are available.
Distributor ID:	Ubuntu
Description:	Ubuntu 14.04.1 LTS
Release:	14.04
Codename:	trusty
# uname -a
Linux *** 3.13.0-43-generic #72-Ubuntu SMP Mon Dec 8 19:35:06 UTC 2014 x86_64 x86_64 x86_64 GNU/Linux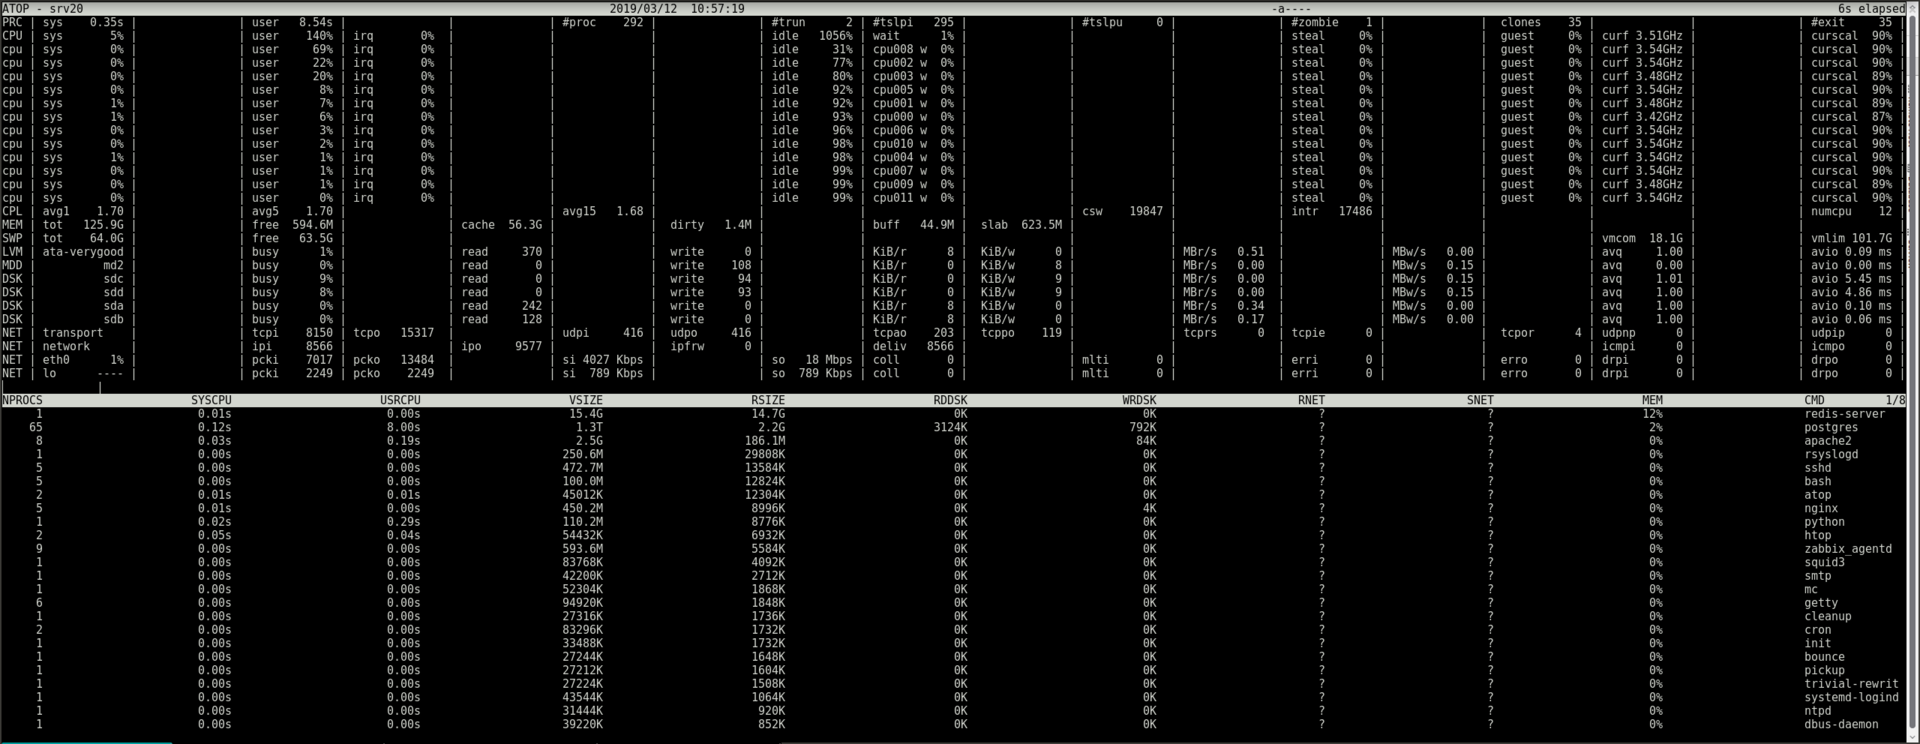
# free -m
             total       used       free     shared    buffers     cached
Mem:        128910     128295        614         15         45      58001
-/+ buffers/cache:      70249      58661
Swap: 65503 486 65017# ps aux --sort -rss | head -5
USER PID %CPU %MEM VSZ RSS TTY STAT START TIME COMMAND
redis 17527 0.1 11.6 16119340 15359700 ? Ssl Mar11 2:22 /usr/local/bin/redis-server 0.0.0.0:****
postgres 3320 1.4 0.0 21683512 63976 ? Ss 10:33 0:37 postgres: root *(3439) idle
postgres 3185 2.0 0.0 21676664 58268 ? Ss 10:33 0:53 postgres: root *(45405) idle
postgres 30150 3.1 0.0 21676344 58184 ? Ss 08:25 5:19 postgres: root *(38249) idle# vmstat
procs -----------memory---------- ---swap-- -----io---- -system-- ------cpu-----
r b swpd free buff cache si so bi bo in cs us sy id wa st
2 0 498100 647344 43184 58972332 14 4 597 331 0 0 15 2 81 2 0# mount -l
/dev/md2 on / type ext4 (rw)
proc on /proc type proc (rw)
sysfs on /sys type sysfs (rw,noexec,nosuid,nodev)
none on /sys/fs/cgroup type tmpfs (rw)
none on /sys/fs/fuse/connections type fusectl (rw)
none on /sys/kernel/debug type debugfs (rw)
none on /sys/kernel/security type securityfs (rw)
udev on /dev type devtmpfs (rw,mode=0755)
devpts on /dev/pts type devpts (rw,noexec,nosuid,gid=5,mode=0620)
tmpfs on /run type tmpfs (rw,noexec,nosuid,size=10%,mode=0755)
none on /run/lock type tmpfs (rw,noexec,nosuid,nodev,size=5242880)
none on /run/shm type tmpfs (rw,nosuid,nodev)
none on /run/user type tmpfs (rw,noexec,nosuid,nodev,size=104857600,mode=0755)
none on /sys/fs/pstore type pstore (rw)
/dev/md1 on /boot type ext3 (rw)
/dev/mapper/megadata-verygood on /data type ext4 (rw,nosuid,nodev,uhelper=udisks)
rpc_pipefs on /run/rpc_pipefs type rpc_pipefs (rw)
systemd on /sys/fs/cgroup/systemd type cgroup (rw,noexec,nosuid,nodev,none,name=systemd)# cat /proc/meminfo
MemTotal: 132004348 kB
MemFree: 621276 kB
Buffers: 39096 kB
Cached: 59445108 kB
SwapCached: 441140 kB
Active: 45814080 kB
Inactive: 31157208 kB
Active(anon): 16139272 kB
Inactive(anon): 1409684 kB
Active(file): 29674808 kB
Inactive(file): 29747524 kB
Unevictable: 10612 kB
Mlocked: 10620 kB
SwapTotal: 67075964 kB
SwapFree: 66583004 kB
Dirty: 24344 kB
Writeback: 16 kB
AnonPages: 17100080 kB
Mapped: 35732 kB
Shmem: 15752 kB
Slab: 655128 kB
SReclaimable: 572604 kB
SUnreclaim: 82524 kB
KernelStack: 2400 kB
PageTables: 57404 kB
NFS_Unstable: 0 kB
Bounce: 0 kB
WritebackTmp: 0 kB
CommitLimit: 106639480 kB
Committed_AS: 18698340 kB
VmallocTotal: 34359738367 kB
VmallocUsed: 494836 kB
VmallocChunk: 34359132264 kB
HardwareCorrupted: 0 kB
AnonHugePages: 11401216 kB
HugePages_Total: 25819
HugePages_Free: 15316
HugePages_Rsvd: 2
HugePages_Surp: 0
Hugepagesize: 2048 kB
DirectMap4k: 106760 kB
DirectMap2M: 9295872 kB
DirectMap1G: 126877696 kB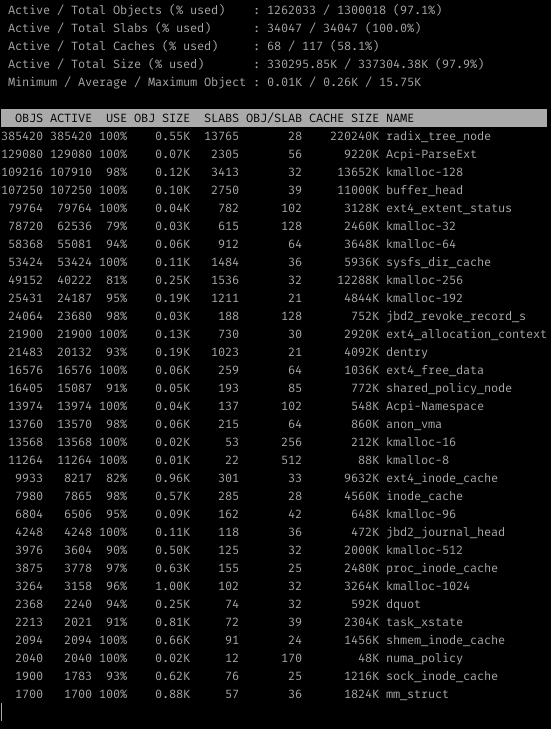 UPD6:
UPD6:# df -h
Filesystem Size Used Avail Use% Mounted on
/dev/md2 1.8T 361G 1.3T 22% /
none 4.0K 0 4.0K 0% /sys/fs/cgroup
udev 63G 4.0K 63G 1% /dev
tmpfs 13G 1.4M 13G 1% /run
none 5.0M 0 5.0M 0% /run/lock
none 63G 4.0K 63G 1% /run/shm
none 100M 0 100M 0% /run/user
/dev/md1 488M 92M 371M 20% /boot
/dev/mapper/megadata-verygood 880G 740G 96G 89% /dataAnswer the question
In order to leave comments, you need to log in
The solution was found. As they say SSZB :) HugePages were allocated on the server , and that's what they were. As it turned out, the system immediately allocates memory for HugePages, and it looks exactly like it is being used , although in fact it may be free.
Thank you all for your participation.
htop doesn't seem to be able to group processes, try atop
In the console interface, press m and then p (before or after press a to turn on / off the display of all processes and not just those that are significant in terms of resource consumption)
This will turn on the sorting mode by memory consumption and then group the records for the same process (on the left there will be a column with the amount) so you will find a process that is running in several copies and one by one consumes little but in total a lot.
What does free -g or free -m show (g for gigabytes, m for megabytes)? perhaps you have half of the memory allocated for the cache and buffers of the operating system, this is normal, it will be freed automatically.
cat /proc/meminfo pay attention to SUnreclaim
if the memory is there, then just reload. as far as I know, there are no other options
, and so, for comparison with other softs, get the top processes by memory occupied:
ps -eo rss,pid,user,command --sort -size | awk '{ hr=$1/1024 ; printf("%13.2f Mb ",hr) } { for ( x=4 ; x<=NF ; x++ ) { printf("%s ",$x) } print "" }' | egrep -v 0.00 |sort -n | awk '{print $1$2" "$3 }'|tailUse this script to list the services that are consuming the most RAM:
ps axo rss,comm,pid \
| awk '{ proc_list[$2]++; proc_list[$2 "," 1] += $1; } \
END { for (proc in proc_list) { printf("%d\t%s\n", \
proc_list[proc "," 1],proc); }}' | sort -n | tail -n 10 | sort -rn \
| awk '{$1/=1024;printf "%.0fMB\t",$1}{print $2}'Didn't find what you were looking for?
Ask your questionAsk a Question
731 491 924 answers to any question