Answer the question
In order to leave comments, you need to log in
How to easily determine the presence of clusters in temporary data?
For small timestamp sets, you need to determine if they are distributed relatively evenly, or are they clustered around separate time points?
The course of statistics is forgotten. Perhaps there is some measure of the uniformity of the distribution of points along one axis?
For example:
[1, 2, 3, 4, 5, 6, 7, 8, 9, 10] // k = 0, идеально равномерно
[1, 2.92, 2.95, 2.96, 2.98, 3.05, 3.07, 6.9, 6.95, 6.99, 7.01, 10] // 1 > k > 0, кластеры около примерно 3 и 7
[5, 5, 5, 5, 5, 5, 5, 5] // k = 1, 100%-плотный кластер в 5Answer the question
In order to leave comments, you need to log in
For the array A(10)
1. Calculate the delta between each neighboring points - blue graph B(9)
2. Calculate the mat. waiting - orange line
3. You count the difference between the mat. expectation and delta at each point, getting C (9)
3. You count the area at intervals of the same length in the array C. Let the interval be equal to 3. You get the array D (9 / 3 \u003d 3) The larger the area in the interval, the higher the density there . You are looking for maxima or minima of areas at intervals of the length you need. There, the points will either cluster or be the rarest. The more time points in general, the prettier the graphics.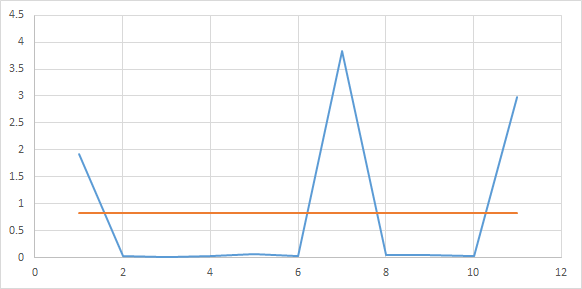
There is a special class of tasks in machine learning - clustering: https://habrahabr.ru/post/67078/ - just for solving such problems
If you do everything "as it should", then the first thing to do is to answer the question - the distribution of the sample differs from the uniform or not. If it differs, then you can go further - look for clusters, or find out what distribution the sample (and through it, the general population) actually has, etc. By and large, in the future, even the choice of the clustering method, if done "correctly", should depend on the result of this stage as well. If it does not differ - well, then everything is clear, no further research is required. After applying the criterion, do not forget to check the significance of the results obtained in order to understand how much they can be trusted.
To determine the "uniformity" of the sample, there are a number of special criteria, the most common of which is the so-called. Sherman criterion. Computationally simple and statistically powerful. (There are other criteria, but the optimal choice of a specific criterion is already a topic for a deeper analysis).
And I also want to draw your attention to the fact that the clustering of time series (namely, series!) Is a little different than just clustering the values of these same series (essentially, no different from clustering static data). Different goals and different methods.
I would suggest a xi-square test for a distribution being a Poisson distribution.
look, you want to group individual records into groups, replacing the properties in individual records with the properties of the whole group, respectively, you lose certain data from the records.
and you can decide for yourself what amount of lost data you are ready to go for when grouping (simplifying) data.
i.e. measure the size of the error after grouping, the size of the clustering is limited from above by the number of records, from below by one, you can start with the number of clusters equal to the size of the number of records, constantly reducing the number of clusters, and estimating the error after this reduction, until the size of the error exceeds the maximum allowable.
this is one method.
==========
the second method is possible: for example, associated with estimating the dynamics of the growth of the size of errors and the reduction in the number of clusters, you can also reduce the number of clusters in the same way without setting the size of the error itself, but by estimating the rate of growth of the error. Roughly speaking, for example, you reduced the number of clusters by 20%, the error increased by 1%, you again reduced the number of clusters by 20%, the error increased by 2%, you reduced the number of clusters by another 20%, the error increased by 30% (probably the last step is not it is worth applying, and leaving the number of clusters at the previous level, well, or try to reduce not by 20% but by 10% and evaluate again)
======
you can come up with other methods related to the measure of proximity between individual elements, when combining them to the cluster.
Didn't find what you were looking for?
Ask your questionAsk a Question
731 491 924 answers to any question