Answer the question
In order to leave comments, you need to log in
How to draw multiple arrows in matplotlib?
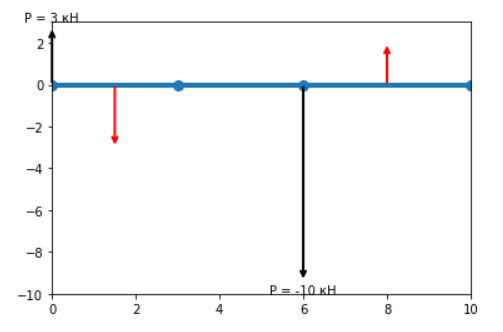
Using matplotlib in Jupyter, I'm trying to draw a beam with loads acting on it. This is necessary to solve the problem of strength of materials.
Distributed loads should be drawn as a set of red arrows (the number is not important), from the beginning to the end of a certain section. So far, I have only been able to achieve drawing one arrow in the middle of the plot.

import matplotlib.pyplot as plt
import numpy as np
import pandas as pd

# дано
data = {'Точка': [0, 'A', 0, 'B'],
        'Сосредоточенные силы, кН': [3, 0, -10, 0],
        'Изгибающие моменты, кН/м': [2, 0, 0, 0],
        'Распределенные нагрузки, кН/м': [-3, 0, 2, 0],
        'Координата начала участка балки, м': [0, 3, 6, 10],
        'Длина пролета балки, м': [3, 3, 4, 0]}
df = pd.DataFrame(data)

# выбираем сосредоточенные силы
concentrate_forces = df['Сосредоточенные силы, кН'] != 0
df.loc[concentrate_forces]

# выбираем распределенные нагрузки
distributed_load = df['Распределенные нагрузки, кН/м'] != 0
df.loc[distributed_load]

fig, ax = plt.subplots()

# устанавливаем размеры длины осей системы координат
limits = df
plt.xlim(0, 10)
plt.ylim(min(limits.min(axis = 0)), max(limits.max(axis = 0)))

# рисуем балку
ax.plot(df['Координата начала участка балки, м'], [0 for i in df['Координата начала участка балки, м']], marker = 'o', markersize = 8, linewidth = 4)

# рибуем сосредоточенные силы
df.loc[concentrate_forces].apply(lambda x: ax.annotate('%s%s%s' % ('P = ', x['Сосредоточенные силы, кН'], ' кН'),
                                                       xy = (x['Координата начала участка балки, м'], 0),
                                                       xytext = (x['Координата начала участка балки, м'], x['Сосредоточенные силы, кН']),
                                                       ha='center',
                                                       arrowprops=dict(arrowstyle="<-", linewidth = 2)), axis = 1)

# рисуем распределенные нагрузки
df.loc[distributed_load].apply(lambda x: ax.annotate('',
                                                       xy = (x['Координата начала участка балки, м'] + x['Длина пролета балки, м'] / 2, 0),
                                                       xytext = (x['Координата начала участка балки, м'] + x['Длина пролета балки, м'] / 2, x['Распределенные нагрузки, кН/м']),
                                                       ha='center',
arrowprops=dict(arrowstyle="<-", linewidth = 2, color = 'r')), axis = 1)Answer the question
In order to leave comments, you need to log in
Didn't find what you were looking for?
Ask your questionAsk a Question
731 491 924 answers to any question