Answer the question
In order to leave comments, you need to log in
How to draw graphs in space on the site?
In general, the question is this: there are two equations, each of which defines its own family of curves (in space). Those. changing the parameter in a specific equation, we obtain the equation of a curve from a specific family.
Task: draw a dozen curves from each family. If you completely pervert, then you can add animation + various data in the window (equation, parameter value ...) changing when hovering over different curves.
This is how I imagine it: graphs are drawn, when you hover over the graph, the plane in which it lies is shown, it itself is highlighted in bold, curves whose graphs overlap the drawing of the plane are shown as a dotted line, somewhere nearby it writes an equation specifying a specific curve. If you click on a point of curves, it displays its coordinates and shows its projection on the Oxy, Oyz, Oxz planes as a dotted line. 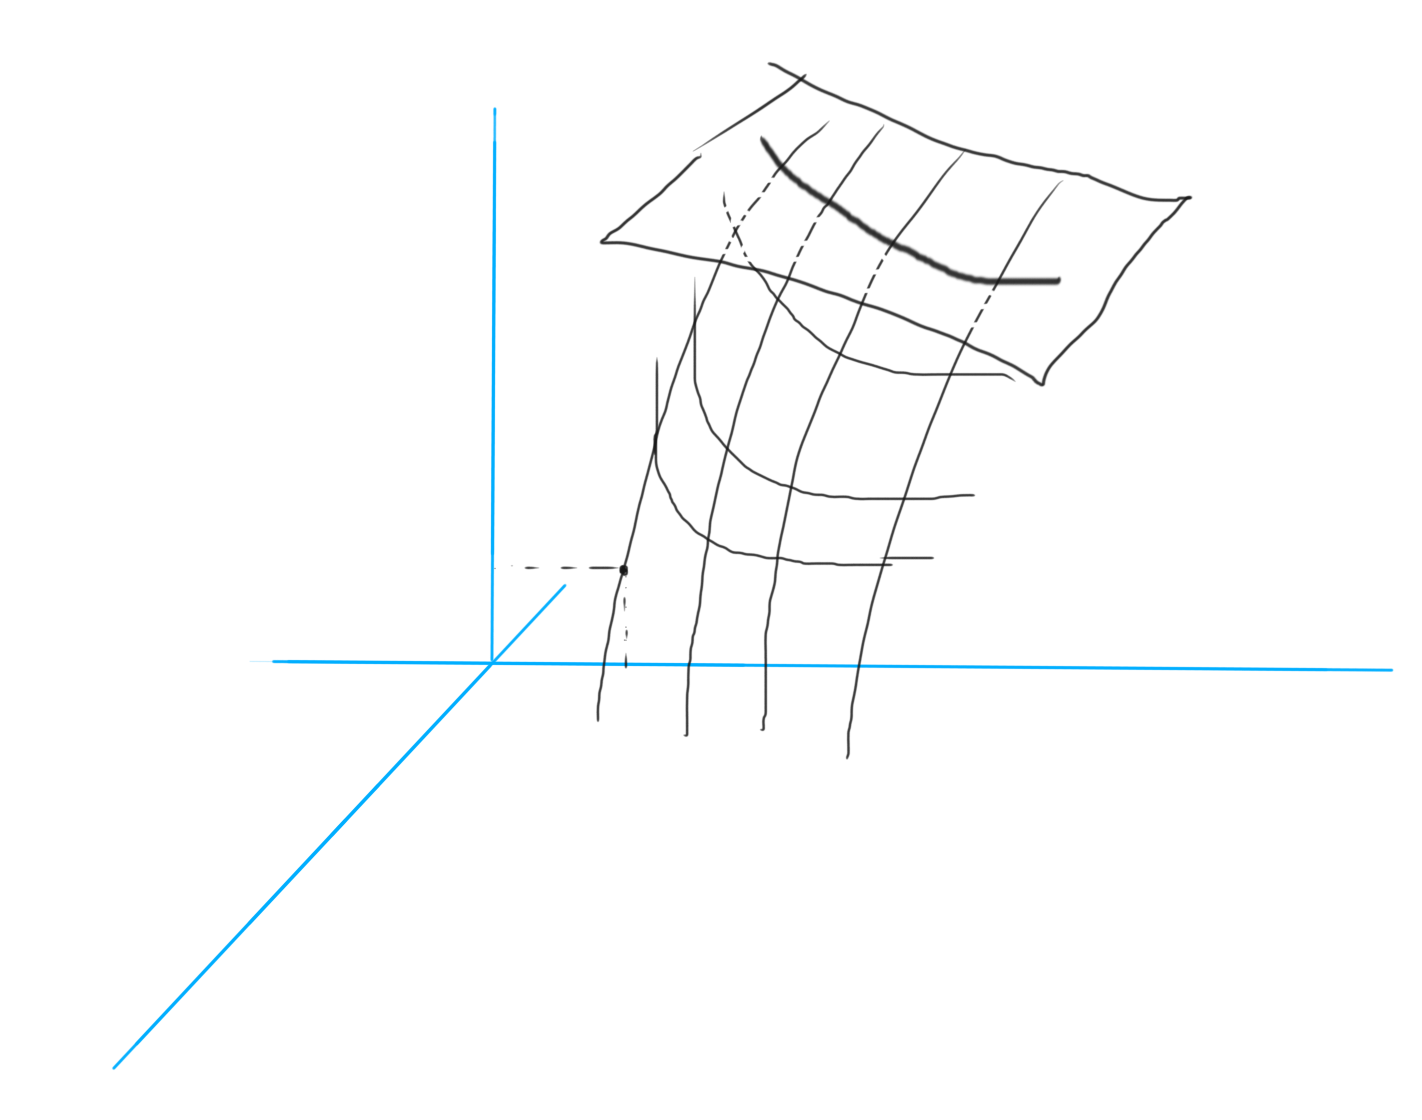
What is the best library to use for this task? Does anyone have experience in solving similar problems?
Answer the question
In order to leave comments, you need to log in
You can use bare WebGL to get maximum control, or you can use three.js or Blend4Web
I have an idea. But of course a little will not suit you, usability will suffer.
There is a language for vector graphics called Asymptote. Very powerful for drawing planes and graphs:
Examples from the gallery: asymptote.sourceforge.net/gallery/3D%20graphs
Available output formats: PDF, PostScript, SVG and 3D PRC.
SVG can be integrated as an image in html.
If desired, you can stick the compiler into the server part and draw a graph through the form.
Didn't find what you were looking for?
Ask your questionAsk a Question
731 491 924 answers to any question