E
E
Effri2021-04-17 17:28:04
SVG
Effri, 2021-04-17 17:28:04

How to draw a scale in the speedometer through the path in the svg image itself from point A to point B?

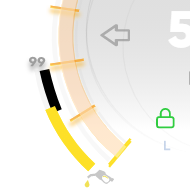
I have, for example, such a 607aede8e3388175595156.png
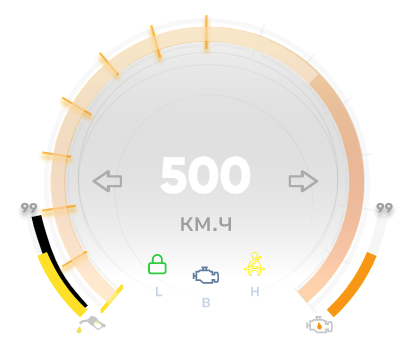
Black speedometer - the fuel scale is indicated. Its final state should be equal to 100. In the code, so far I have written it this way:

<path id="fuel" d="M18.5 185.5C18.5 185.5 25.1111 216 36.5 236.5C46.5 254.5 66 274 66 274" stroke="black" stroke-width="9" :stroke-dasharray="deffuel + fuel" style="stroke-dashoffset: 504.267" width="100px"/>
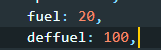

The :stroke-dasharray="deffuel + fuel" part of the code is implemented in vue, which depends on the value of "fuel", and already deffuel is the starting coordinate for drawing the curved line, to which the value from fuel is simply added. 607aef287015c082311721.png

When I make a value, let's say fuel: 50, the scale is drawn in exactly the opposite way (top to bottom, not bottom to top), and it becomes just a broken circle in 50 point increments. 607aef6e3eed4112334879.png

How can I make it draw this semicircle for me correctly? What attribute in svg can be responsible for this?

Answer the question

In order to leave comments, you need to log in

1 answer(s)
A
Alice, 2021-04-17
@w3bsmes

Oh something familiar.
Hold , hold and topic .

If you are too lazy to search by sorts.
тык

Didn't find what you were looking for?

Ask your question

Ask a Question

731 491 924 answers to any question