Answer the question
In order to leave comments, you need to log in
How to draw a "normal" plot in PypPlot?
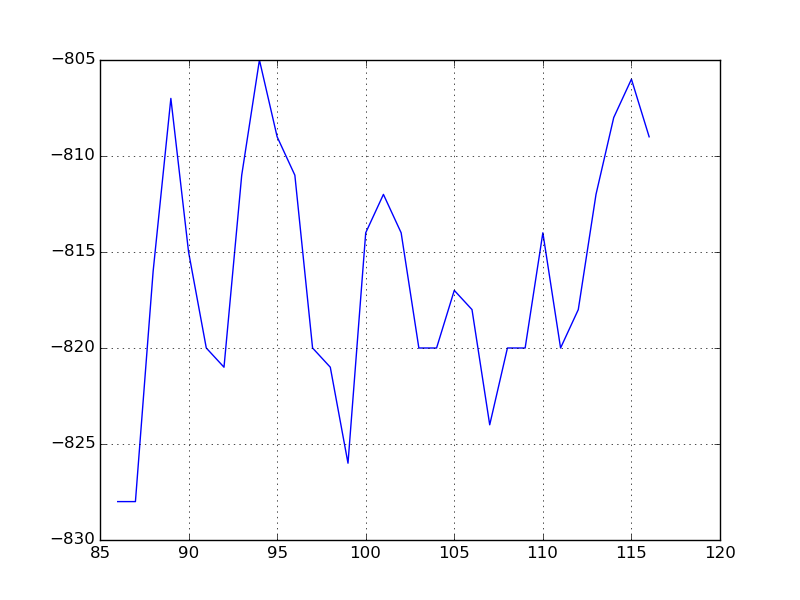
Hello! I'm trying to draw graphs with PyPlot. So far it looks funny: 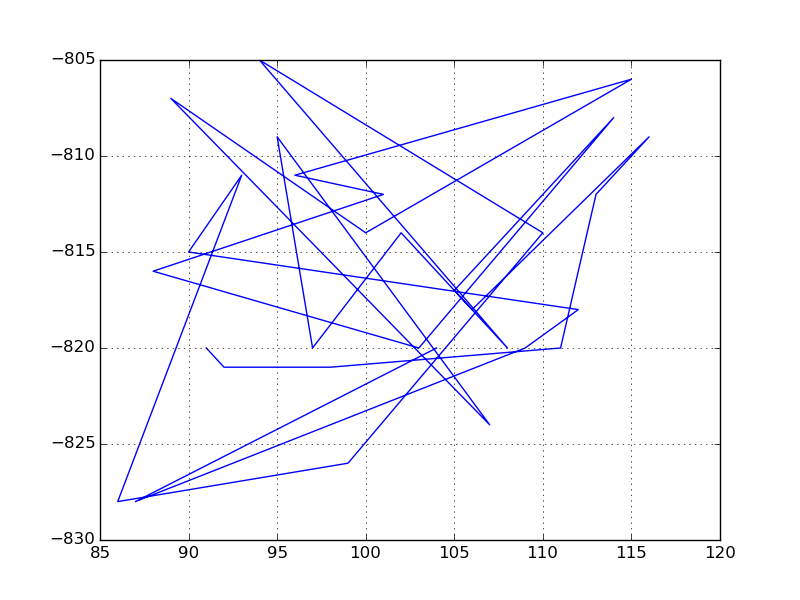
But if you look at the points, you can draw a "normal" graph, without intersections 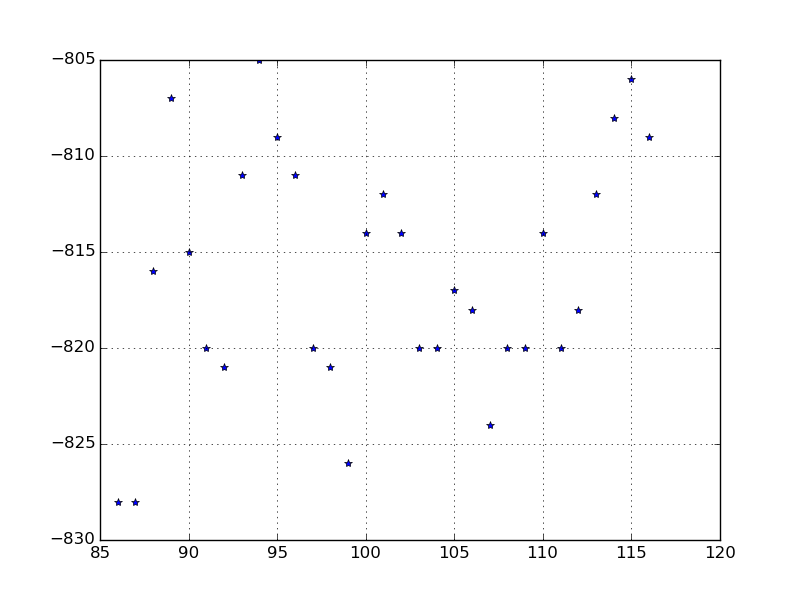
How to make sure that there are no intersections in the lines?
Answer the question
In order to leave comments, you need to log in
Didn't find what you were looking for?
Ask your questionAsk a Question
731 491 924 answers to any question