Answer the question
In order to leave comments, you need to log in
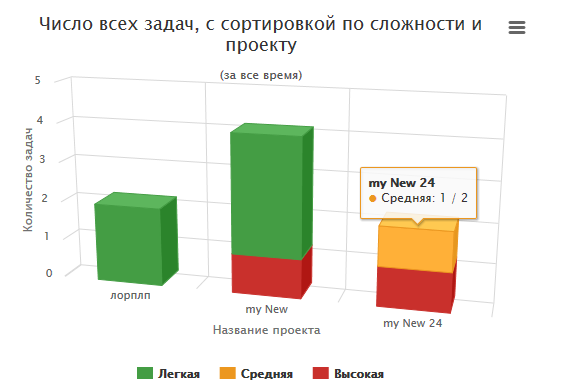
How to display time in a graph?
Good day.
I have received time that I spent on any project. Let's say I spent 1 day, 2 hours, 3 minutes and 26 seconds on the first and second projects. Data is stored in variables:
$day = 2;
$hour = 2;
$min = 3;
$sec = 26;
Answer the question
In order to leave comments, you need to log in
time scale in hours
$hours = $days*24 + $hour + $min/60 + $sec/3600;
$hours = round($hours);

$timeline = range(1, $hours); // [1, 2, 3, ... $hours]Didn't find what you were looking for?
Ask your questionAsk a Question
731 491 924 answers to any question