Answer the question
In order to leave comments, you need to log in
How to display relationships between microservices?
Good day, the task is the following.
It is necessary to visually display the relationship between microservices (servers) based on data from the database.
That is, the parent-child relationship, something like this:
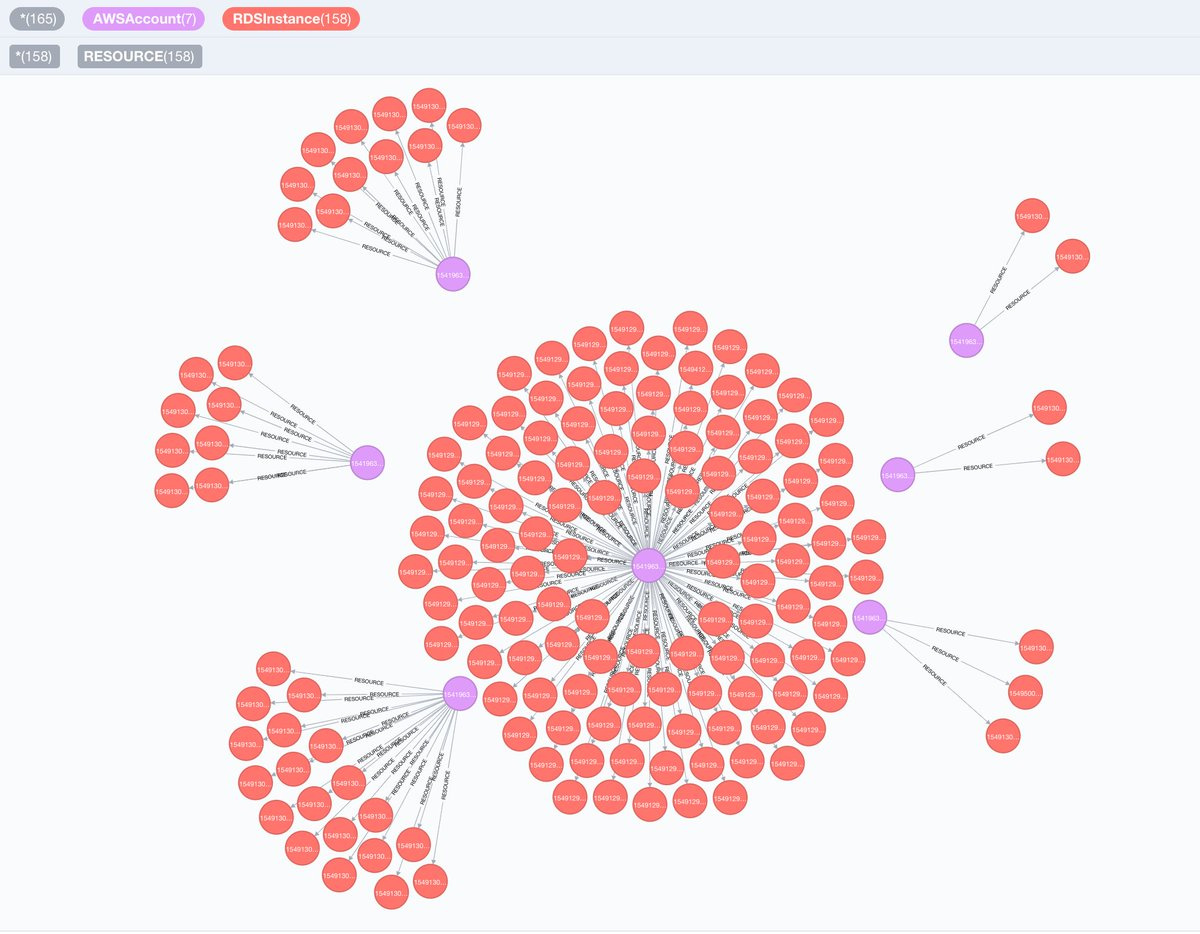
At the same time, all this should be dynamic, that is, based on data from the database.
Some servers depend on others, others work independently, some can be turned on / off, some are a cluster to increase capacity and work with one highly loaded program (that is, 3 servers for one microservice, for example).
The DevExpress toolkit is available.
I recently started learning wpf so I have no idea how to achieve the goal. Any ideas?
Sorry for such an abstract question.
Answer the question
In order to leave comments, you need to log in
Relationships between microservices are a graph.
Accordingly, you need some library for graph visualization.
Look at this one, for example: https://github.com/panthernet/GraphX
If you used normal cluster software like Istio, kiali would be perfect for you https://kiali.io/docs/features/topology/
And look in the direction of graphs. Graphviz Example viz-js.com
Pixie ( https://pixielabs.ai/ ) gives such a graph, plus loading. NewRelic makes it possible to install it and see the result in a couple of minutes.
Didn't find what you were looking for?
Ask your questionAsk a Question
731 491 924 answers to any question