Answer the question
In order to leave comments, you need to log in
How to display a summary report in Google Sheets?
Hello!
Friends, please help to cope with the task of the summary report in Google.
I still can’t figure it out in any way ...
The task is as follows:
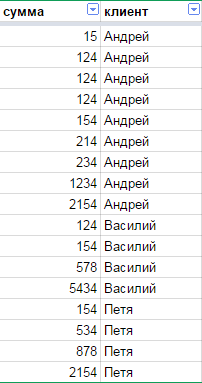
There is a table in Google Sheets: 
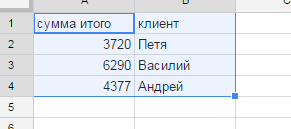
how to make a summary of this format from this table: 
and automate the process for the future?
Through the "Data" - "Pivot Table" I managed to do this:
Picture
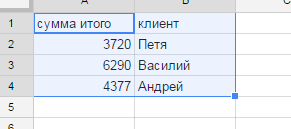
And what to do next to get this result ??? 
It is necessary that the amount be written immediately next to the name, and not all the values \
u200b\u200bare listed .... Please write in detail step by step - what goes where and how ..
Thank you in advance :)
Answer the question
In order to leave comments, you need to log in
You need to select all the data from your plate along with the title, click Data ... pivot table, then on the right
Rows ... add a field ... client
Values \u200b\u200b... add a field ... sum
then you can insert a line above to drive in text with column names
Didn't find what you were looking for?
Ask your questionAsk a Question
731 491 924 answers to any question