Answer the question
In order to leave comments, you need to log in
How to debug content scripts in Google Chrome extension?
The fact is that even though content scripts can interact with the document, they still have their own separate window - accordingly, I can’t just open the inspector and look at this or that variable, since the functions and variables declared in the content script are only available from him.
The question naturally arises, how then to debug content scripts at all, if you can’t interact with them through the console in any way? Maybe there is some secret? I obviously do not understand something, because there must be a way to switch the console to display the window environment of the content script.
PS I used to always embed my code in a document and then work with it, but today for the first time I had a need to execute the code without embedding it on the page and stumbled on debugging.
Answer the question
In order to leave comments, you need to log in

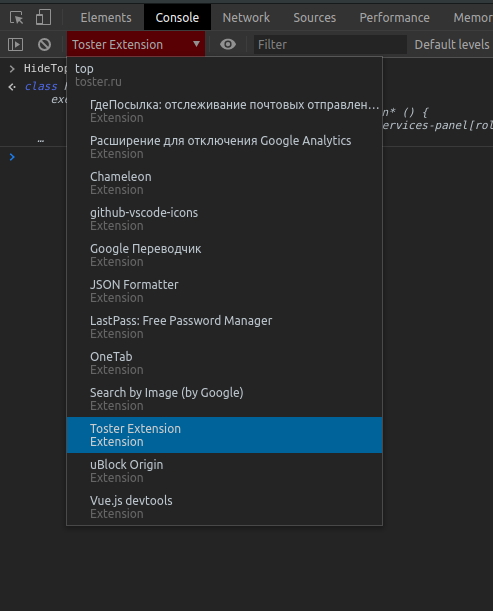
We select the context in the console and go ahead, debug at least until the morning
Didn't find what you were looking for?
Ask your questionAsk a Question
731 491 924 answers to any question