Answer the question
In order to leave comments, you need to log in
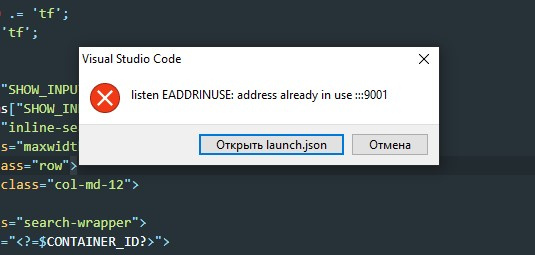
How to configure xdebug vscode?
Good day!
Installed OpenServer, on which a copy of Bitrix is deployed.
I open the project with vscode.
I would like to set up php debugging in vscode.
To set up debugging, the following steps were performed:
1) phpinfo() was displayed on the test page;
2) the content of phpinfo(); added on https://xdebug.org/wizard
3) .dll file configured
4) dll added to openserver settings (D:\OpenServer\modules\php\PHP_7.1-x64)
5) "PHP Debug" extension installed in vscode "
6) in the php.ini settings, the port is 9001
7) in the vscode launch.json settings it is written
{
      "name": "Listen for Debug",
      "type": "php",
      "request": "launch",
      "port": 9001
    },
    {
      "type": "php",
      "request": "launch",
      "name": "Отладка",
      "program": "${file}",
      "cwd": "${fileDirname}",
      // "runtimeExecutable": "/usr/bin/php",
      "port": 9001
      },

Answer the question
In order to leave comments, you need to log in
Perhaps it will help someone:
1) install the LiveServer application (screen 1) 
2) open the file in which the js file is connected (I have a regular index.html)
3) run it using LiveServer (right-click to open the action window) (screen 2 ) 
4) the page will open in the browser
5) pay attention to the address bar (the port is of interest. For example: localhost:5500 )
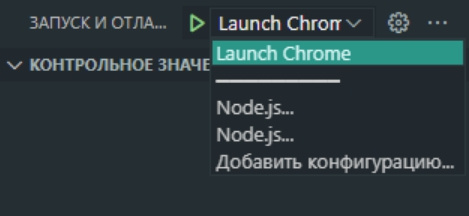
6) in VsCode go to the debugging section, generate debug json (screen 3) 
7) in json specify the port that was opened via LiveServer
Example json:
{
  // Используйте IntelliSense, чтобы узнать о возможных атрибутах.
  // Наведите указатель мыши, чтобы просмотреть описания существующих атрибутов.
  // Для получения дополнительной информации посетите: https://go.microsoft.com/fwlink/?linkid=830387
  "version": "0.2.0",
  "configurations": [
    {
      "type": "pwa-chrome",
      "request": "launch",
      "name": "Launch Chrome",
      "url": "http://localhost:5500",
      "webRoot": "${workspaceFolder}"
    }
  ]
}Didn't find what you were looking for?
Ask your questionAsk a Question
731 491 924 answers to any question