Answer the question
In order to leave comments, you need to log in
How to check internet connection in Grafana (zabbix)?
The question of such a plan.
There is Zabbix thrown Grafana on it and there is also an IP address, let's say 192.168.1.2
How to check this IP address in Grafana,
whether something has fallen off or the connection check.
this is the most important Internet IP address, it has microtics and so on.
How to check it all?
Answer the question
In order to leave comments, you need to log in
Nothing is clear, but very interesting (c)
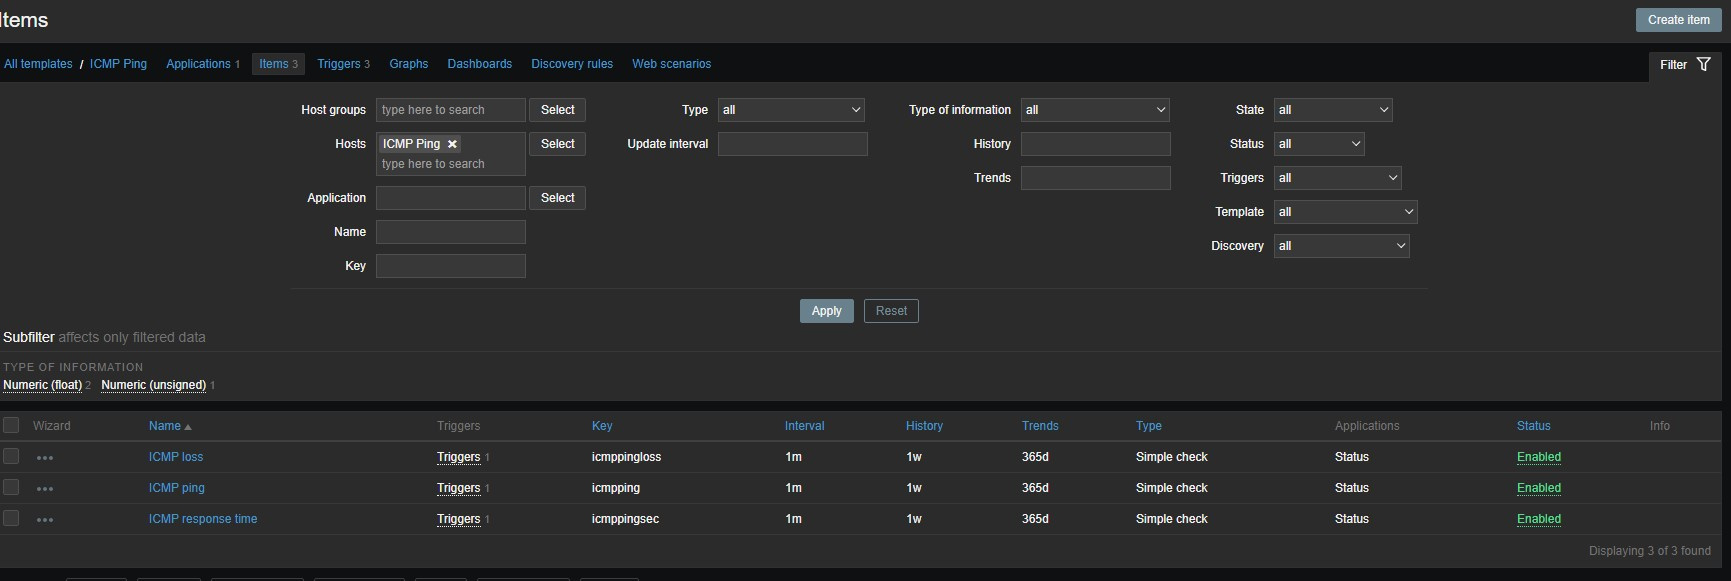
Zabbix has standard data elements for such cases - icmppingand net.tcp/udp.service. Are they not enough?
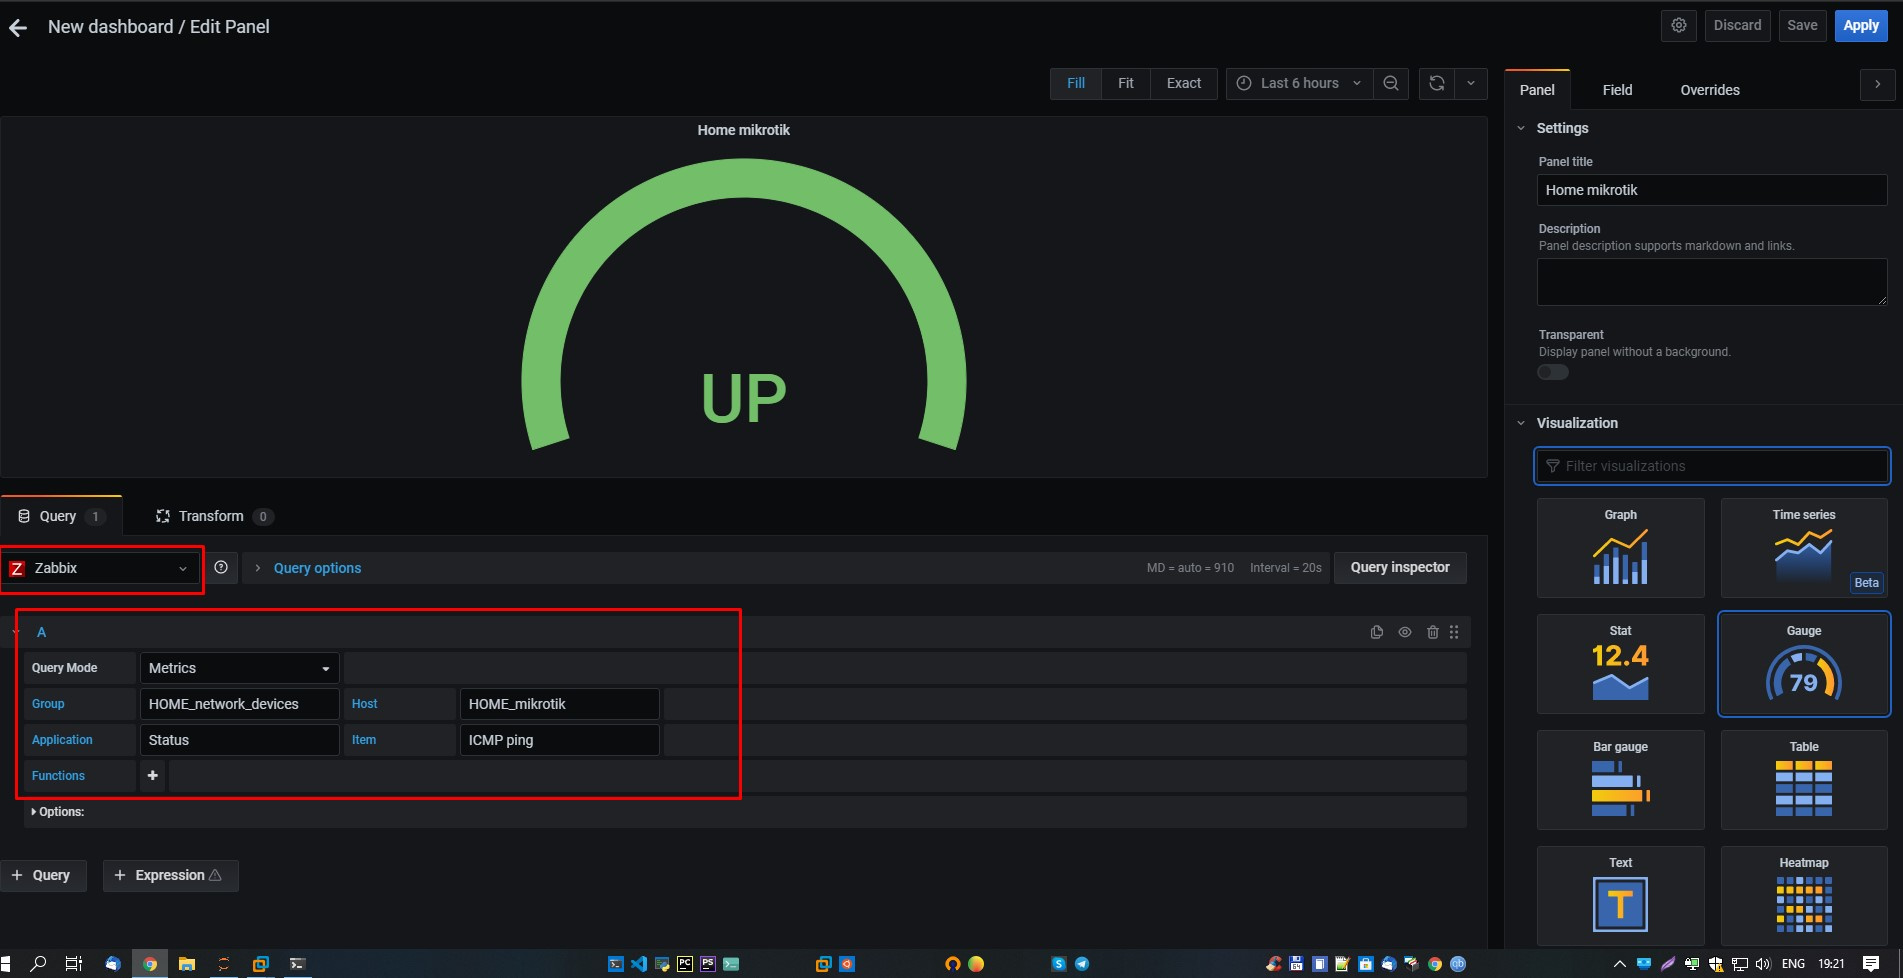
Well, first of all, the graphanya doesn’t check anything, it’s a stupid dashboard, a beautiful data output shell
can check zabbix, but it checks what it was given in the rules, elements and triggers
, so compose and write the necessary rule according to which you will check and how it this case will issue
just ping once a minute through icmpping your IP
I would add the nearest router of your provider, some IP thread in the city and some IP thread abroad.
And in grafana you already draw a sign for everyone, it will be clearly seen at what stage the problem is.
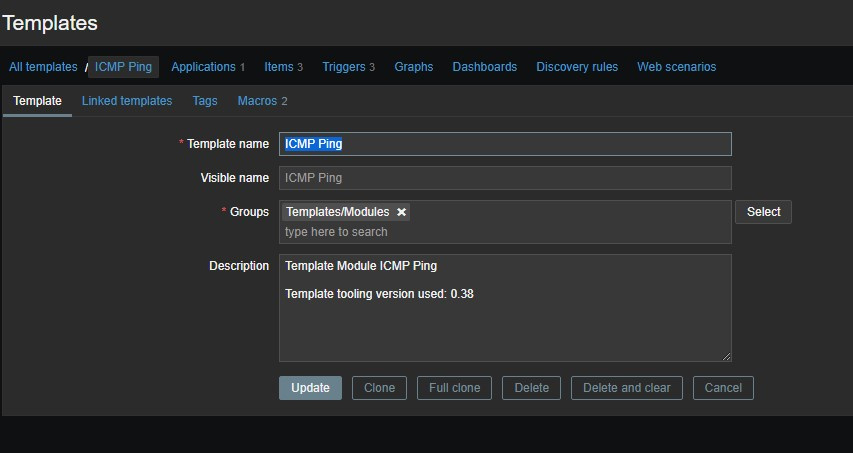
In zabbix, create a host and hang template ICMP Ping on it


Didn't find what you were looking for?
Ask your questionAsk a Question
731 491 924 answers to any question