Answer the question
In order to leave comments, you need to log in
How to change the fill of one of the graphs in Maxima?
There is a chart like this:
wxplot3d (,
   5*sin((x+y)/3), [x, -5, 5], [y, -5, 5]],
   [x, -5, 5], [y, -5, 5])$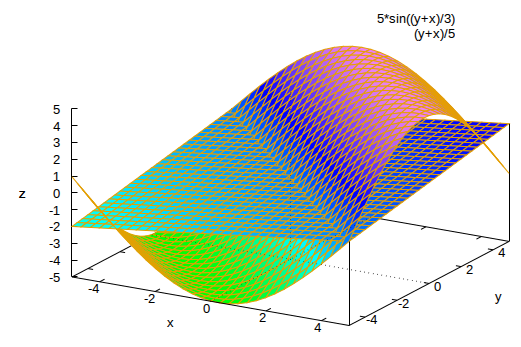
plot3d (log (x^2*y^2), [x, -2, 2], [y, -2, 2],[grid, 29, 29],
       [palette, [gradient, red, orange, yellow, green]],
       color_bar, [xtics, 1], [ytics, 1], [ztics, 4],
[color_bar_tics, 4])$Answer the question
In order to leave comments, you need to log in
Didn't find what you were looking for?
Ask your questionAsk a Question
731 491 924 answers to any question