Answer the question
In order to leave comments, you need to log in
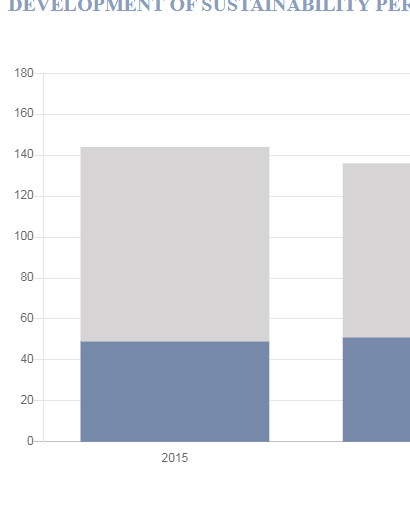
How to change the data on the vertical axis of a bar chart?
There is a bar chart, on the vertical axis the values are from 0 to 180, but you need to have 0% 50% and 100% and that's it. How can I do that?
Answer the question
In order to leave comments, you need to log in
Didn't find what you were looking for?
Ask your questionAsk a Question
731 491 924 answers to any question