Answer the question
In order to leave comments, you need to log in
How to change chart axis spacing?
Hello. Please tell me, I have such a problem. I display the values in the Chart, and the graph is built differently. For example, I start the x-axis from 40, and on the graph, the values start from 39. Everything is visible in the attached file. Please tell me how to get rid of it.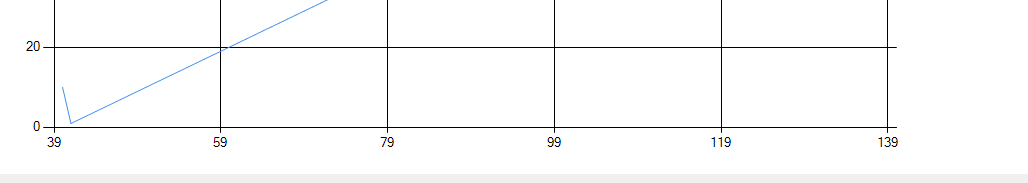
Answer the question
In order to leave comments, you need to log in
I guess there are no answers because no one knows that you are using WinForms\WPF\Web?
I can suggest a couple of good libraries for the first two: OxyPlot and the younger project LiveCharts
Didn't find what you were looking for?
Ask your questionAsk a Question
731 491 924 answers to any question