Answer the question
In order to leave comments, you need to log in
How to catch abnormal readings of a temperature sensor?
There is data from the temperature sensor, it is necessary to analyze them and catch readings that go beyond the boundaries of the normal mode. Moreover, periodic peaks of values ​​\u200b\u200bare included in the normal mode, and sometimes jumps can occur even higher, and this is also considered the norm. Now I calculate the standard deviation and empirically (read - from the bulldozer) I set the coefficients by which it is multiplied in order to determine the boundaries of the dangerous temperature and the critical one. In the picture they are marked with horizontal lines - green, yellow and red.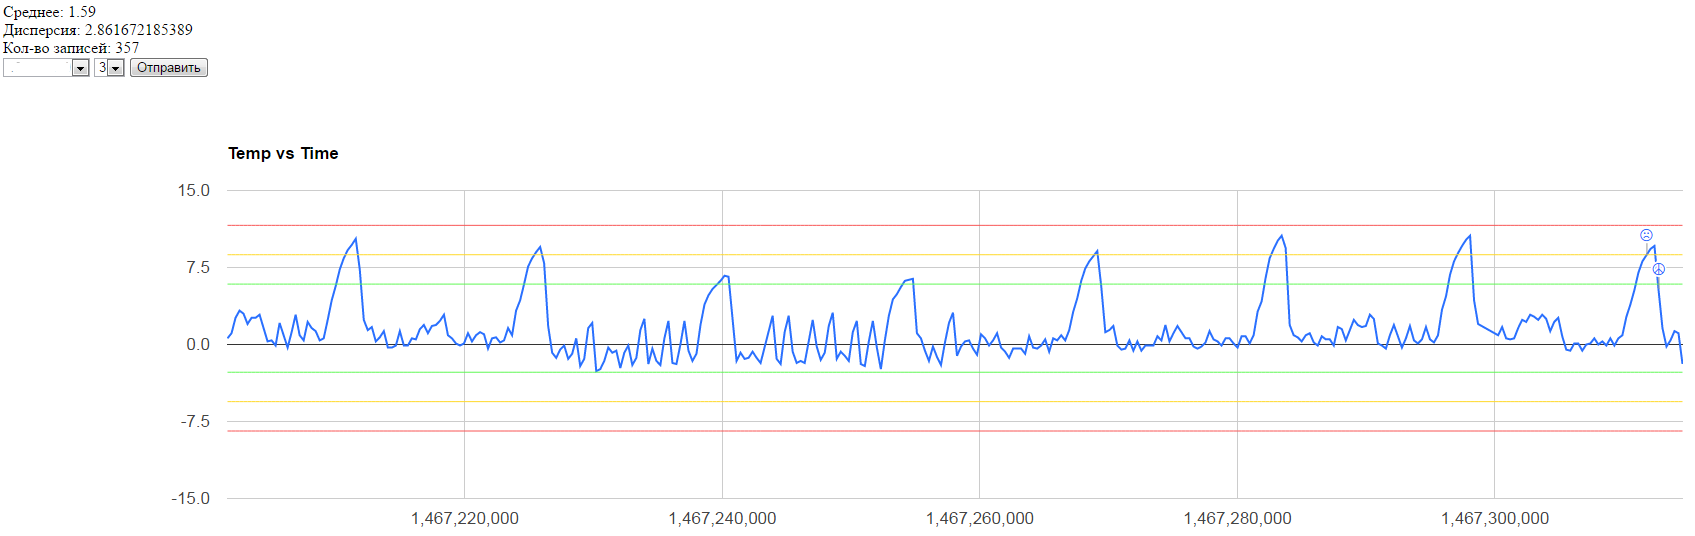
If the temperature is above critical for a certain time, I generate an alarm message. But I am tormented by the feeling that this method is not entirely reliable. If the data were more or less even, it would work, but, taking into account periodic jumps, the boundaries do not look the way I think they should look. Please let me know if there are any other ways to determine this. I guess that it is necessary to dig into the distributions, but at the institute they were very superficial, and it was not yesterday.
So far, only grouping values ​​​​by zones comes to my mind, and the farther the current zone is from the most densely populated one, the higher the probability of an accident. But will it be more accurate than the standard deviation? The subtle point is that I need not only to indicate the emergency situation as accurately as possible, but also to avoid false positives. Thanks in advance for your advice.
Answer the question
In order to leave comments, you need to log in
https://habrahabr.ru/post/130873/
The Bizier curve is what you need.
To begin with, determine the causes of emissions, why do you have them periodically?
Then use the moving average, determine the size of the window from the potential inertia of the system.
Well, the temperature in the room cannot rise by 10 degrees in 5 seconds.
I advise you to clearly formulate the task and compare it with the solution. While it seems that you are doing the opposite. Statistics and low-pass filtering are needed to get rid of noise. The temperature sensor gives you the right readings, why try to remove the peaks?
So, give a clear definition of what you need. So far I understood that there are 3 modes: normal, critical and emergency. What do you understand by analysis? Just leveling up or is there time involved?
Your first decision is to set the levels (filtering discarded for now). Does it not suit you? On what basis did you choose them? If you don't know the answers, ask your boss.
I have done about the same.
There are several parameters:
1) Minimum
2) Maximum
3) Critical minimum
4) Critical maximum
5) Maximum time
These parameters are changed by technologists, calibration - by engineers.
The logic is as follows:
1) If the temperature goes beyond the critical parameters - this is an TROUBLE - a message is immediately displayed.
2) If the temperature went beyond the "minimum" or "maximum", but did not exceed the "Maximum time" - then a WARNING.
3) If the temperature went beyond the "minimum" or "maximum", but exceeded the "Maximum time" - then TROUBLE - displays a message.
The parameters depend on the time of day,
There are 26 temperature sensors, 18 door opening / closing sensors.
This solution has been working for more than a year.
Didn't find what you were looking for?
Ask your questionAsk a Question
731 491 924 answers to any question