Answer the question
In order to leave comments, you need to log in
How to calculate the start and end points of the regression line, which should be set at the beginning and end of the chart (see screenshot)?
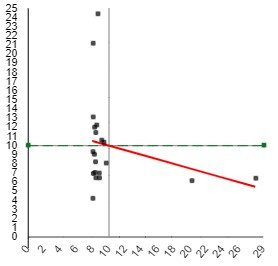
the left and right ends of the line should continue to the edges of the graph. I can't figure out what formula to use for this.
chart is built in js with chart.js
Answer the question
In order to leave comments, you need to log in
The line is y = ax+b, where the parameters are found from minimizing the sum of squared differences (y - Yi).
Didn't find what you were looking for?
Ask your questionAsk a Question
731 491 924 answers to any question