Answer the question
In order to leave comments, you need to log in
How to calculate the heart rate by means of programming?
I have a pulse sensor; I digitize the signal through the microcontroller and transfer it to the computer. (signal in the photo). How to calculate the heart rate, if the base level and the level of peaks sometimes change from the pressure of the sensor?
Tell me the algorithm or code in C (C ++), Python, Pascal.
Signal as an array with values: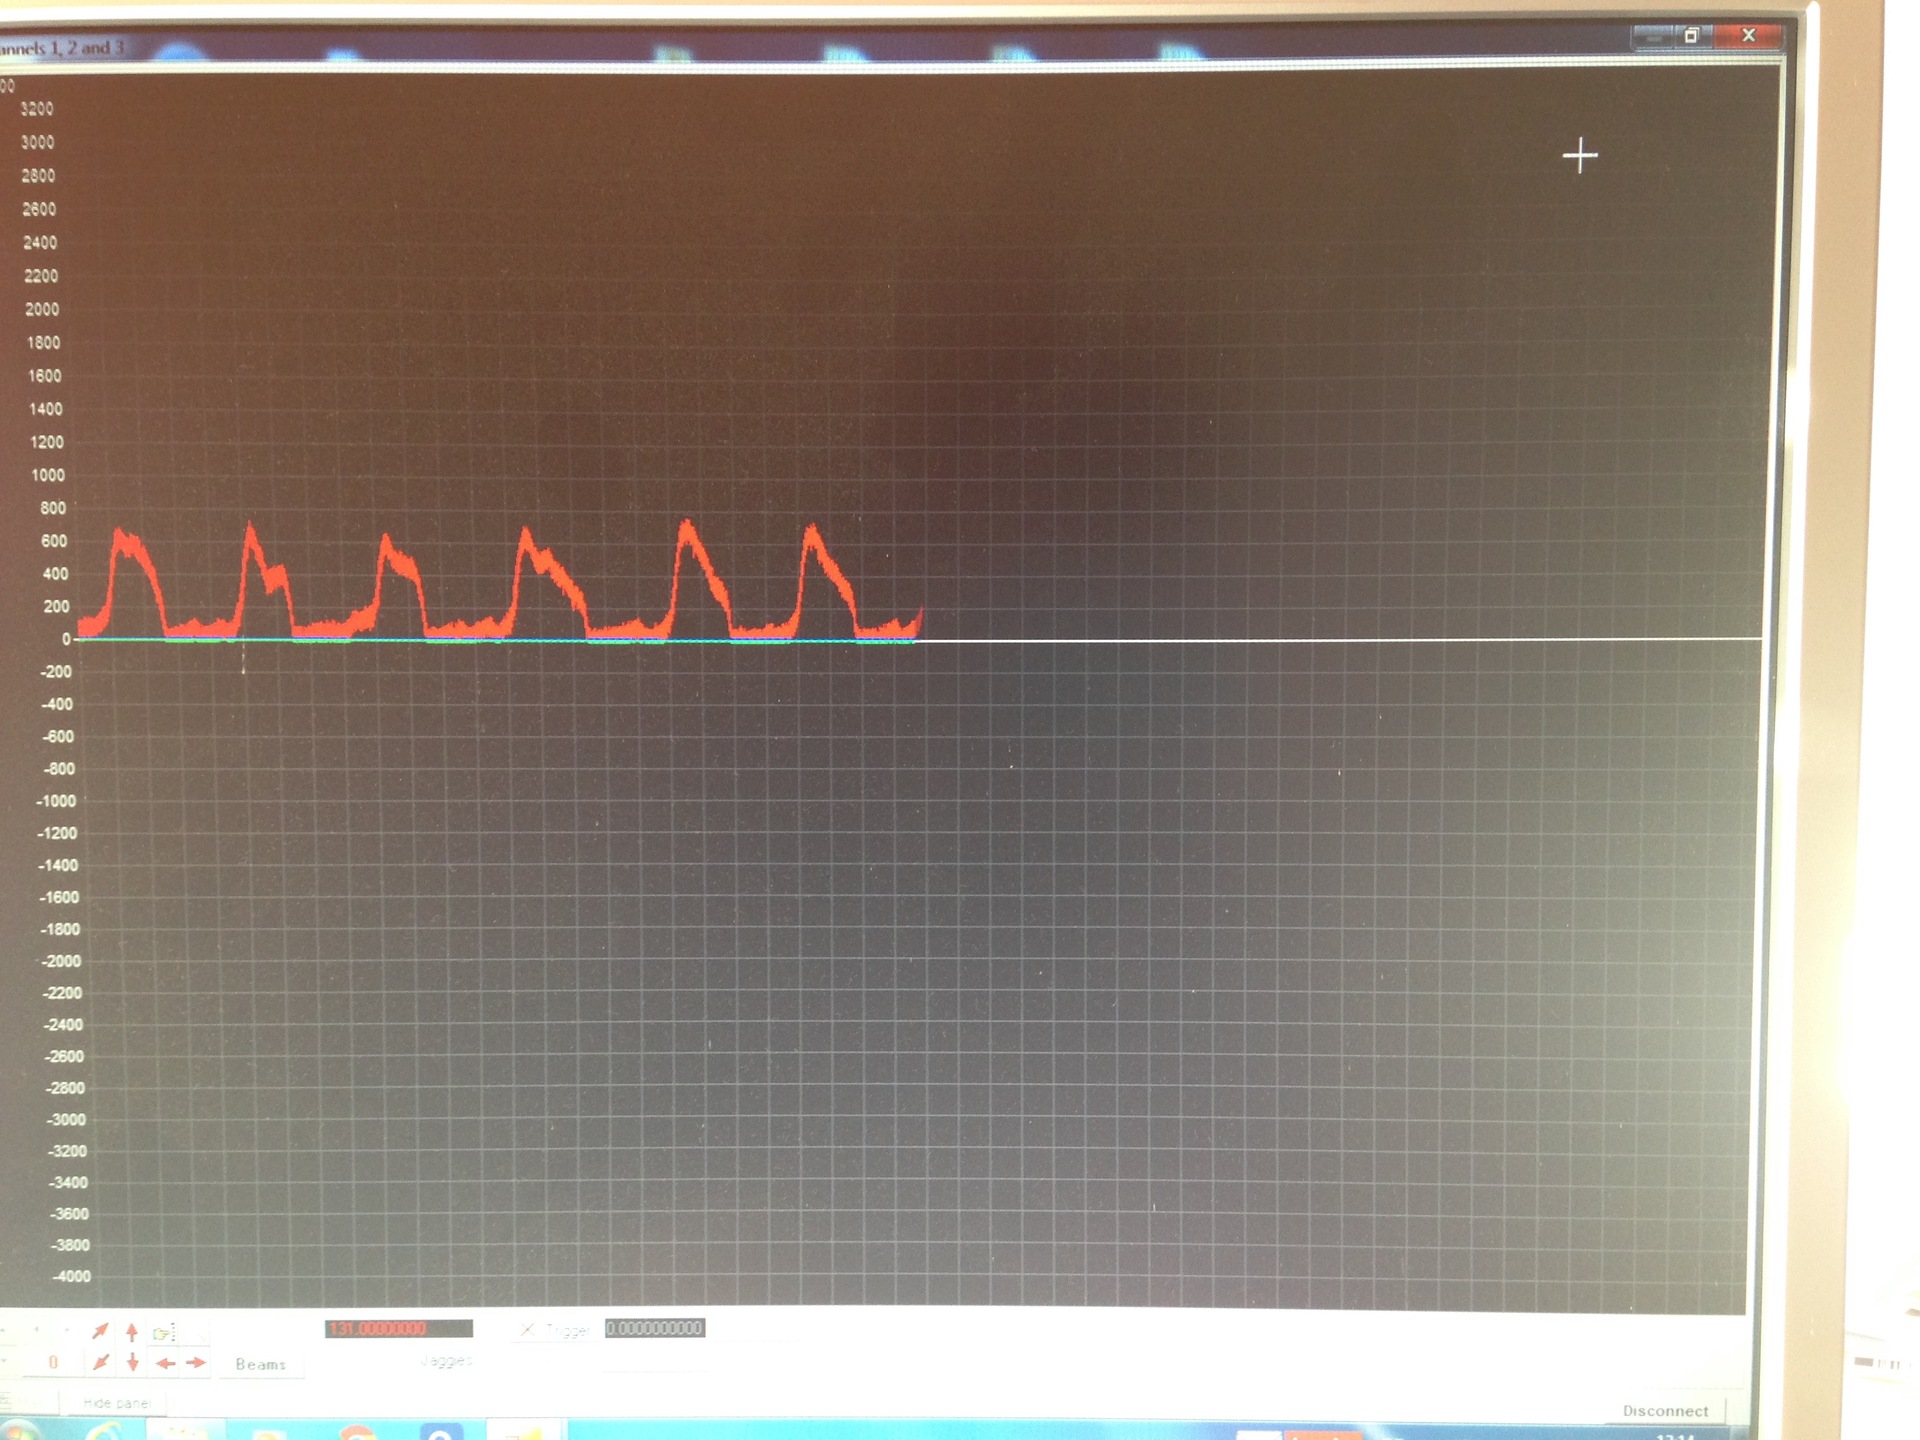
Answer the question
In order to leave comments, you need to log in
Get the signal spectrum. The harmonic with the largest amplitude will be the pulse rate.
1. Filter the signal. (options: Fourier transform, wavelet transform)
2. Select special points (eg peaks)
This can be done like this:
i. Find the maximum value of the amplitude
ii. We find all points that are > 0.5 from the maximum. (0.5 is taken at random, more/less can be taken depending on the possible difference)
iii. We will get a set of intervals of points, for each interval we select the maximum value. This is our peak.
To improve the performance of the algorithm, you can search for points not on the signal itself, but on the Wavelet decomposition of this signal (that is, for each decomposition level, we perform the operation described above, then we compare the data).
I did something similar to matlab, for python there is a library with Wavelet / Fourier transforms for sure.
You can make a two-threshold function. Let the signal change from zero to one. Let's take two thresholds, one at 0.1, the other at 0.9. Let's take a variable x that takes two states: high and low. If the signal value falls below 0.1 and x = "high", change x to "low". Rise from x = "low" to 0.9, change to "high".
Each time the variable changes its value to high, we count the pulse. The only thing is to observe how the amplitude behaves. It can divide by the maximum for the last 10 seconds, and observe the parameters. It is best if there is a decent marked history with the pulse and you can immediately start testing on the training, cross and control samples.
Analyze the number of pauses over a period of time.
It should also be taken into account that there may be heart defects (arrhythmia, etc.), due to which the graph may look different.
Didn't find what you were looking for?
Ask your questionAsk a Question
731 491 924 answers to any question