Answer the question
In order to leave comments, you need to log in
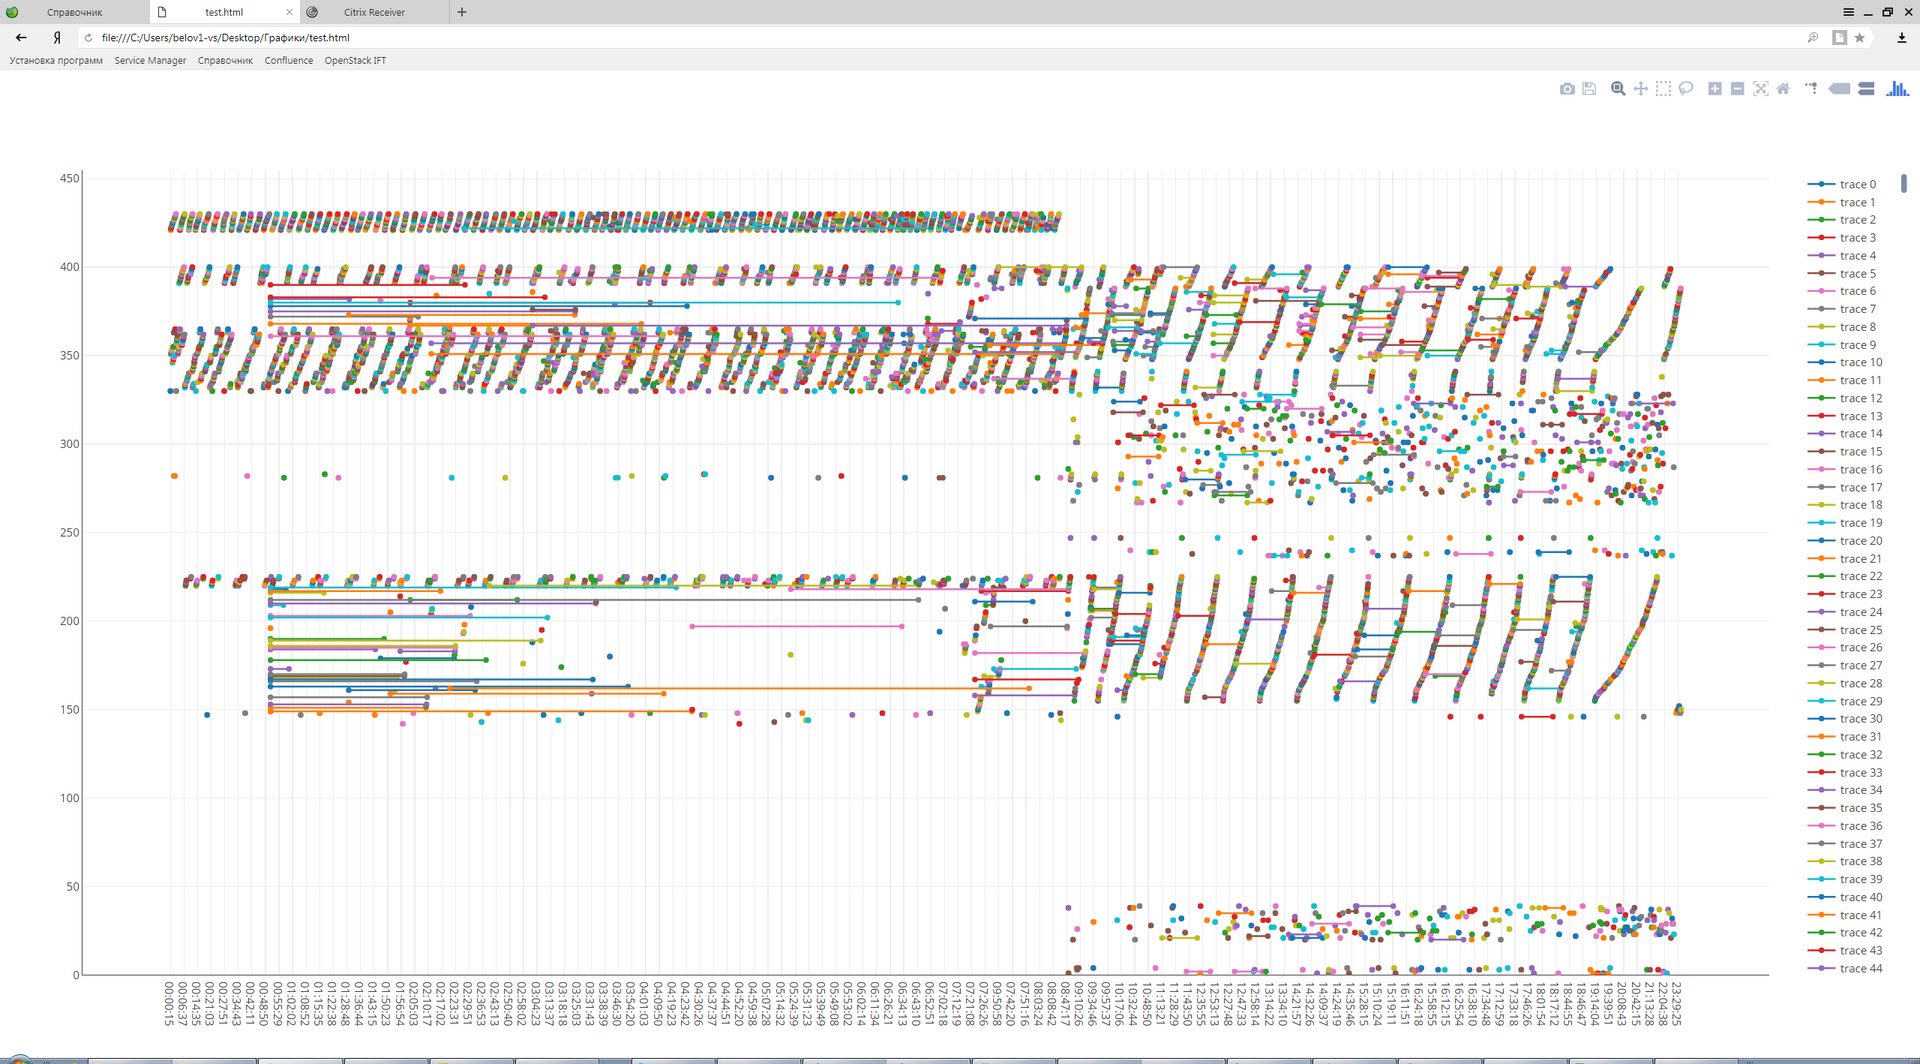
How to build a timeline chart?
Good afternoon. Can you please tell me what tool to use to plot the graph? There are about 400 machines running about 50 processes. I would like to see the names of the machines in the Y plane, the timeline in the X plane. From the data, there is a machine name, a process name, a start time, and an end time. What do you advise? Thanks
Answer the question
In order to leave comments, you need to log in
According to the description you gave - pencil and paper.
Well, really, how can we recommend a tool if we don’t know anything - whether the data will be received one-time, or you monitor your devices dynamically, your desk-top application or data is generated on the server (400 machines after all), and viewed on the client, or via the web? Is it necessary to display in the form of a graph (what exactly) or is it enough to have "light bulbs" - whether the process is running on the machine or not. Should I show the process name? Can more than one process be running on the same machine at the same time? How (protocol) is the data transferred from the monitoring device to the application that displays the graph? Etc. Give a FULL description of the task, then the answers will be realized. And so - well, they will tell you - for example - grafana. Or matplotlib. Or D3.js. Or Dygraphs. Or Tableau. Or maybe MS Visio is right for you? What are you going to do with these answers?
Didn't find what you were looking for?
Ask your questionAsk a Question
731 491 924 answers to any question