Answer the question
In order to leave comments, you need to log in
How to make progress bar/chart in javascript in drawable style?
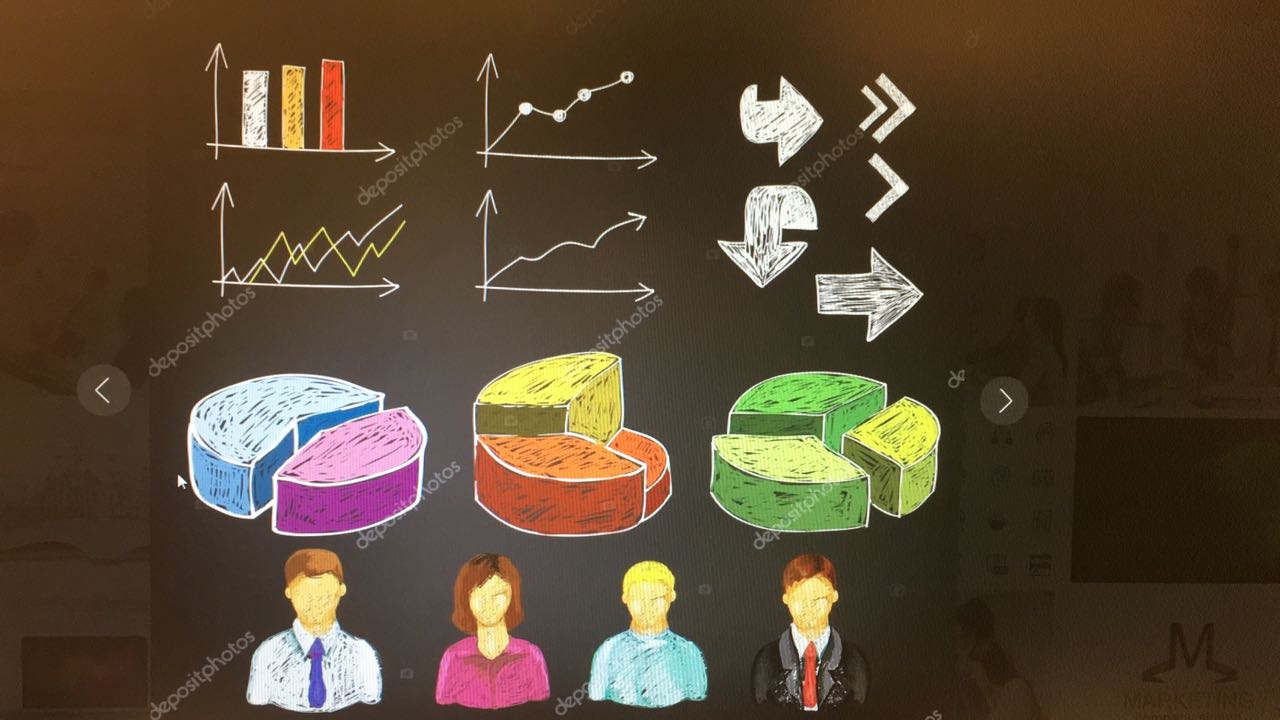
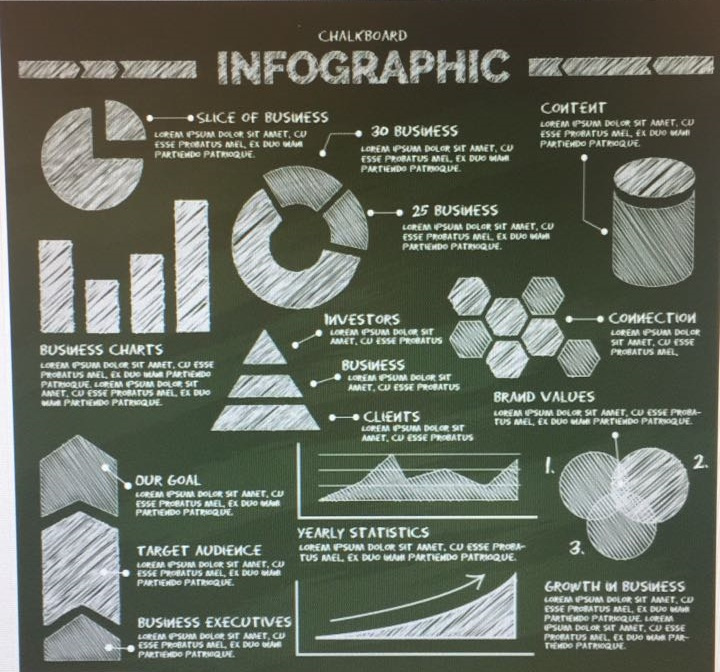
I'm doing a personal account with reporting. Done on Sharepoint using JavaScript. I would like to insert not a standard progress bar, but in a drawn style (pictures below).
There are two options to consider:
1) Make a sector of a static image transparent, depending on the percentage of the task completed. But it is not clear which library to use if the picture is of a non-standard shape (not a circle, but an ellipse or a 3D graph with a slope)
2) Generate similar objects yourself. The question is - does someone know the right javascript library that allows you to make such bars / graphs / charts?
Answer the question
In order to leave comments, you need to log in
Didn't find what you were looking for?
Ask your questionAsk a Question
731 491 924 answers to any question