Answer the question
In order to leave comments, you need to log in
How to build a graph so that it contains only the filled data, and not the entire selected range?
There is a table in which every day we fill in the cell of column B. Column C is calculated by the formula: С2=B2+C1.
So that there are no unnecessary values in the dates that have not come in column C, I upgraded the function =ЕСЛИ(B8="";"";B2+C1).
Question. How to build a graph so that it contains only the values filled in the table? But not the entire operating range.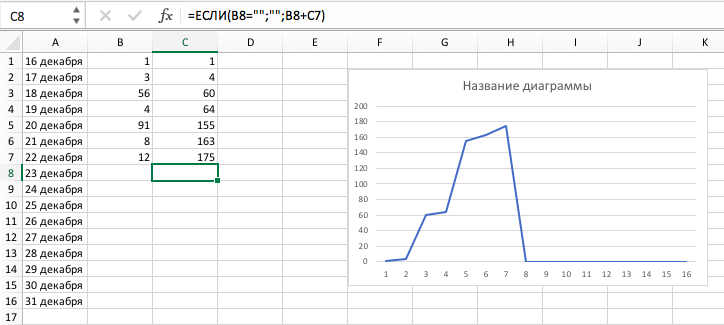
Answer the question
In order to leave comments, you need to log in
Make an additional column with the date, which will use the formula to take the date from column A if there is data in column B or C, and leave it empty if not., select this column in the chart as a data source (for the X axis) and hide it in table so as not to interfere (fill it down with 'with a margin')
Didn't find what you were looking for?
Ask your questionAsk a Question
731 491 924 answers to any question