Answer the question
In order to leave comments, you need to log in
How to build a 3D graph by points?
Hello, I have a question about 3D graphics.
There is an array "int[ , ]" in it points the height value. The values of each cell are the z coordinate. The problem is if you take a random line of the array, then there will be such data { ... 0, 0, 0, 50, 0, 0, 0, 0, 76, 89, 56, 0, 0, 0, 0, 0 ... }.
It is necessary to build a 3D graph between non-zero points.
Similar to excel.
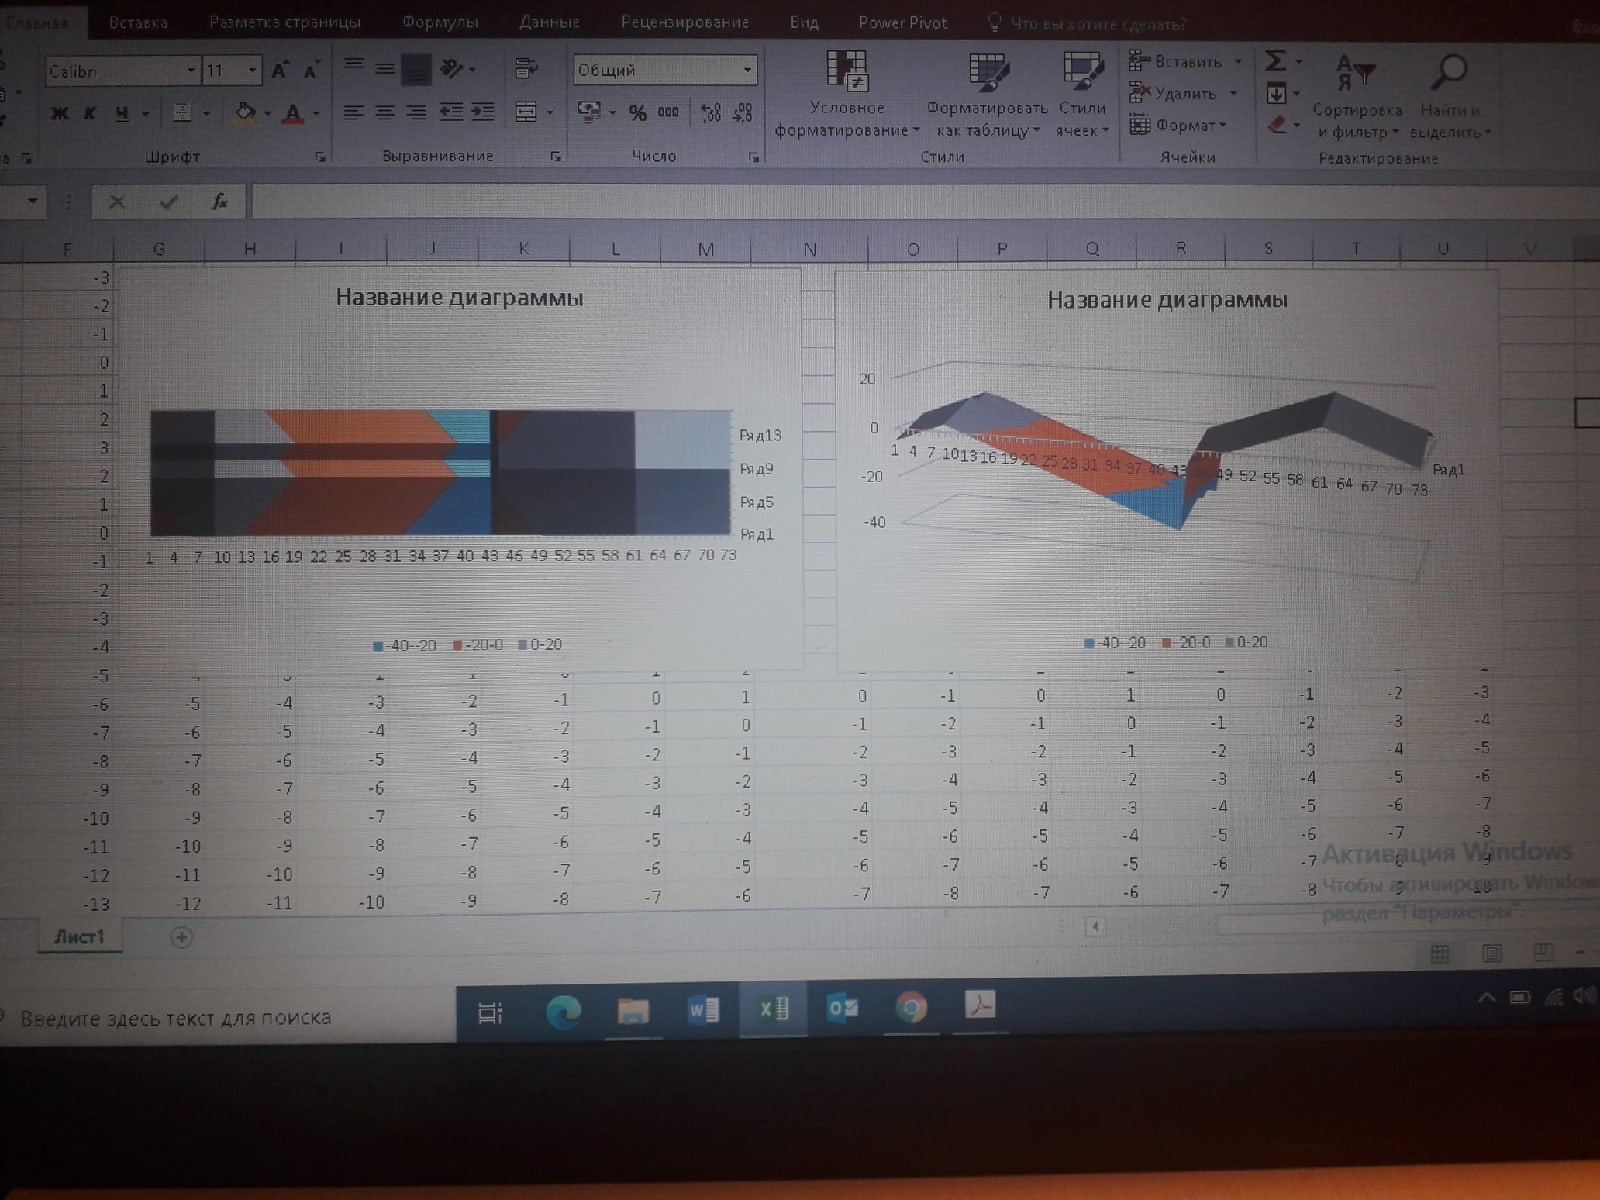
Only without gaps in ( 0 ).
PS It's hard for me to explain.
Thank you in advance for your response.
Answer the question
In order to leave comments, you need to log in
Didn't find what you were looking for?
Ask your questionAsk a Question
731 491 924 answers to any question