Answer the question
In order to leave comments, you need to log in
How to allocate money according to charts?
Please tell me how to reduce 2 graphs, I've been breaking my head for 4 days.
I'll explain how it is.
On the 1st graph, people's rates are displayed at the dollar rate, the X-axis is the bet, the Y-axis is the amount of the bet
On the 2nd graph, the winnings are displayed in % ratio, from the X bet, the Y-axis % approach to winnings
That is, 64.85 - 100% winnings, 62.75 - winnings 0
It is required to distribute the bank, for example, in the amount of 10,000 among users who placed bets, but taking into account their bet.
That is, in fact, you need to reduce these 2 graphs, but I don’t understand how to do this. asking for help from experts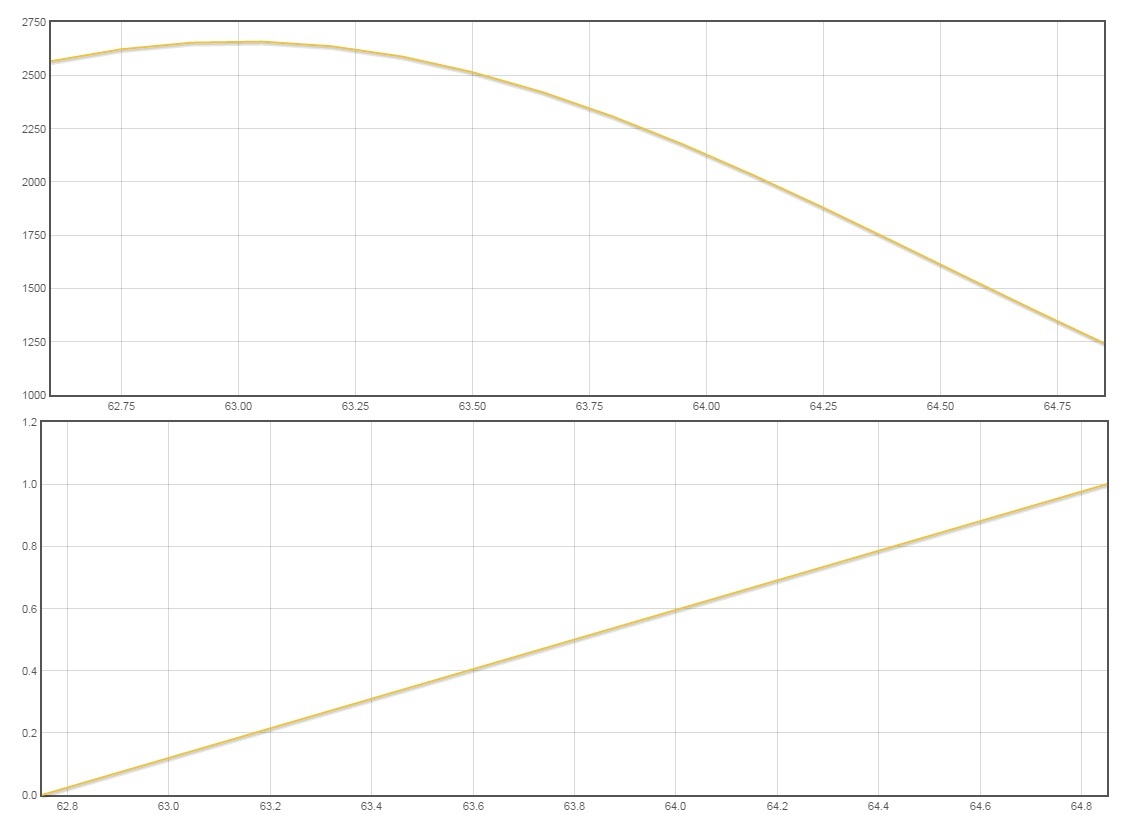
Answer the question
In order to leave comments, you need to log in
Come up with a conventional unit "santik".
Consider that the winnings of each (in cents) is equal to the product of his bet by the percentage of winnings (it does not matter if the winnings are counted from 0 to 1 or from 0 to 100).
Calculate the total winnings in cents.
Calculate the rate of santik based on the fact that the total winnings is 10,000.
Recalculate the winnings of each.
If the bet amount is S(X), and the winning percentage is V(X), then
C=10000/sum(S(X)*V(X)) is the rate of the santhik
W(X)=S(X)*V( X)*C - final win.
Why complicate that?
You have 10,000 and the total stake for each user.
You just need to do this:
[Bank balance]=10000-[SumTotalUser1Stake]*K1-[SumTotalUser2Stake2]*K2-...-[SumTotalUserStakeN]*KN
where K1,K2 - coefficient. income.
Didn't find what you were looking for?
Ask your questionAsk a Question
731 491 924 answers to any question