Answer the question
In order to leave comments, you need to log in
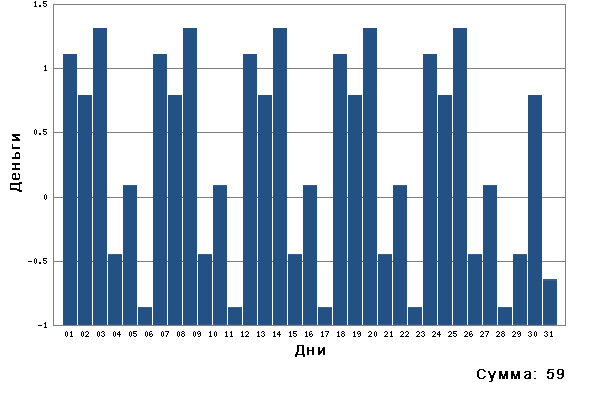
How can I make a diagram from a ready-made piece of code?
There is a piece of code
<div class="dataTableFooter">
    <table>
      <tbody>
  <tr>
    <td class="pages">
      <span><?php echo Page::getLanguageString("Months:", "Monat:", "Месяц:"); ?></span>
<?php
  $y = NULL;
  for ($i = 0; $i < count($months); $i++) {
      if ($y === NULL || $y != $years[$i]) echo " <span>" . $years[$i] . ":</span>";
      $y = $years[$i];
      if ($y == $year && $months[$i] == $month)
    echo " <strong>" . $shortMonthName[$month] . "</strong>";
      else {
    echo " <a href=\"?lang=" . Page::getLanguage() . "&year=$y&m=" . $months[$i];
    if ($uid && $tid) echo "&uid=$uid&tid=$tid";
    else if ($uid) echo "&uid=$uid";
    else if ($tid) echo "&tid=$tid";
    else if ($cid) echo "&cid=$cid";
    else if ($coid) echo "&coid=$coid";
    else if ($rid) echo "&rid=$rid";
    echo "\">" . $shortMonthName[$months[$i]] . "</a>";
      }
  }
?>
    </td>
<?php $s = Page::getLanguageString("Total: ", "Summe: ", "Сумма: "); ?>
<?php $total = sprintf(Page::getLanguageString("%u.%02u", "%u.%02u", "%u,%02u"), floor($total / 100), $total % 100); ?>
    <td class="total"><?php echo $s; ?><strong><?php echo $total; ?></strong></td>
  </tr>
      </tbody>
    </table>
</div>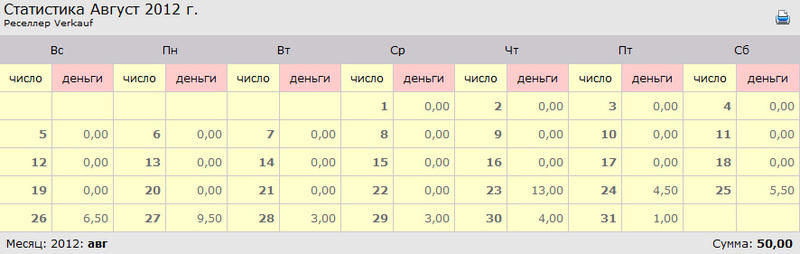
Answer the question
In order to leave comments, you need to log in
if ($uid && $tid) echo "&uid=$uid&tid=$tid";
else if ($uid) echo "&uid=$uid";
else if ($tid) echo "&tid=$tid";
else if ($cid) echo "&cid=$cid";
else if ($coid) echo "&coid=$coid";
else if ($rid) echo "&rid=$rid"
Thank you very much for your help! relic agreed to help me with the diagram.
JS-of course it’s beautiful, but if the customer wants to save it, it will have to be in the picture. Therefore, it is better right away, in it. gd2 + php, nothing complicated, debugging will take time according to the size. And if JS, then there are “chips” in the text-jies / raphael.
Didn't find what you were looking for?
Ask your questionAsk a Question
731 491 924 answers to any question