Answer the question
In order to leave comments, you need to log in
How are zooming and panning implemented in SVG on this page?
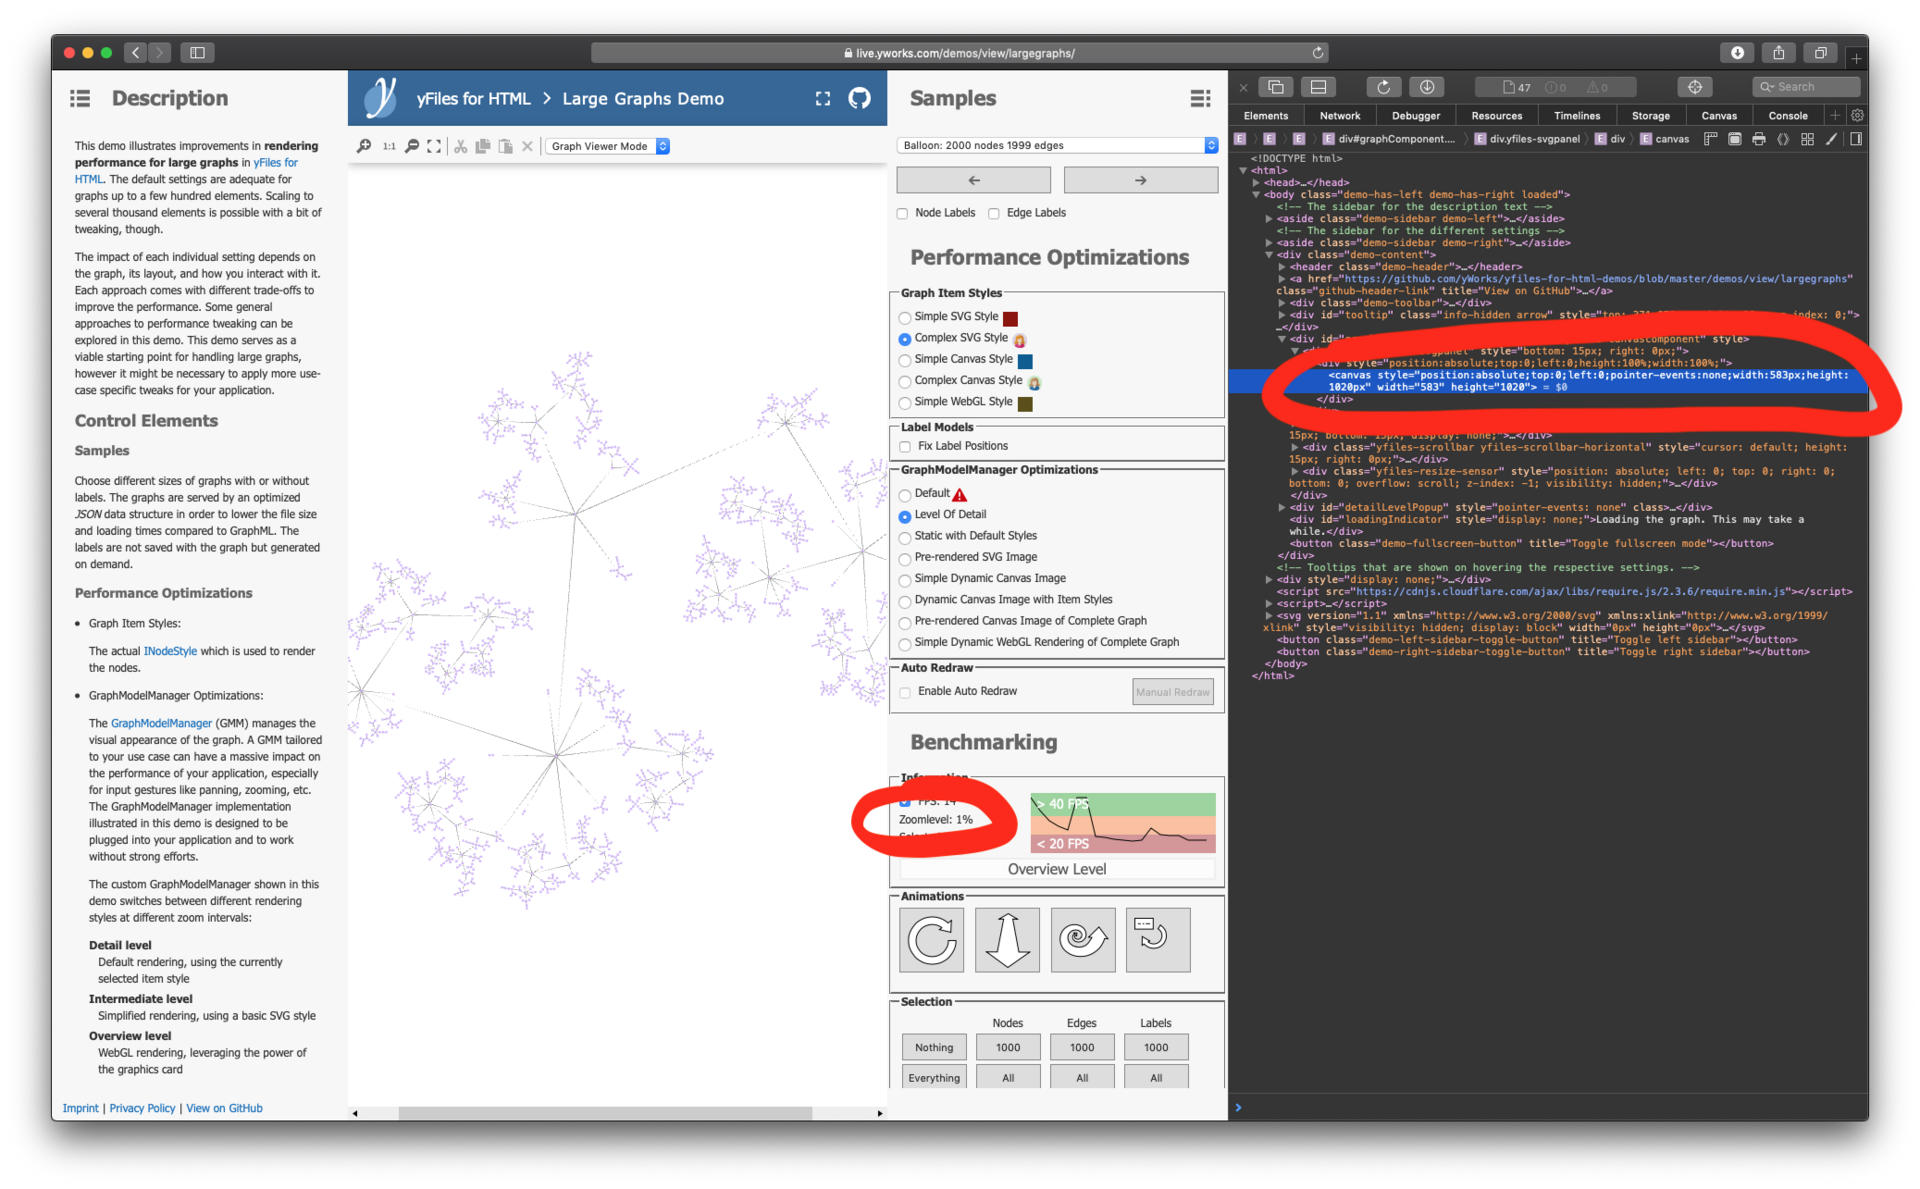
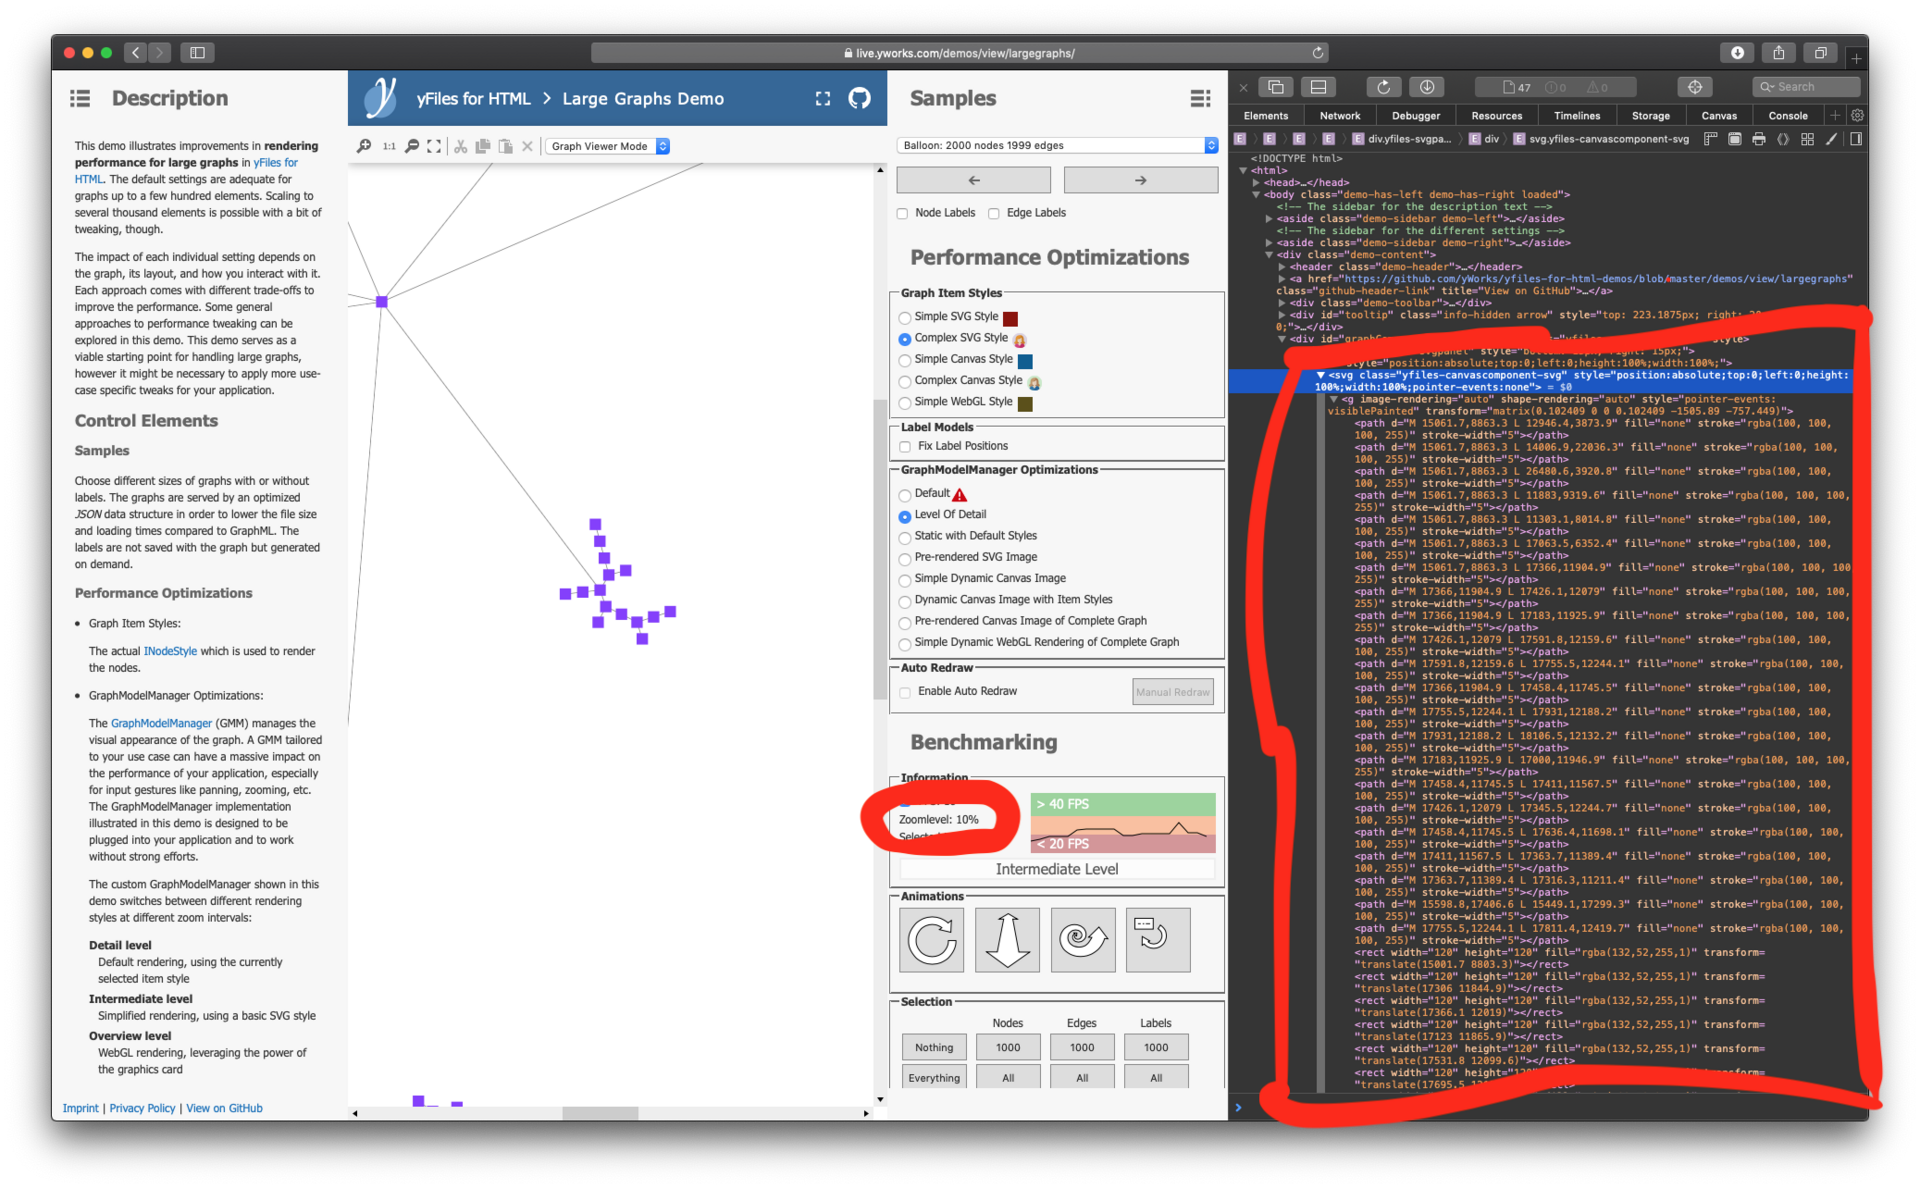
Link to a demo application that draws a graph on a page using Canvas-WebGL and SVG (depending on the scale): https://live.yworks.com/demos/view/largegraphs/
The graph can be scaled (mouse wheel) and panned ( move on it; drag).
At a scale of 0–9% (“Overview Level”), the graph is drawn using Canvas-WebGL: 
At a scale of 10–100% (“Intermediate Level” and “Detail Level”), the graph is drawn using SVG: 
To the question: when changing the scale and panning, in SVG mode, you can see changes in the DOM tree (in ): SVG elements appear and disappear (there are only those , , etc. in the DOM tree that should be visible at the current scale and position), but none of them<svg>...</svg><path><rect>the attribute (as well as the attributes of all their parents that can affect their position and scale, such as, for example, transform, dor style) does not change . Confused :-/
How does the position and scale of SVG elements change?
Answer the question
In order to leave comments, you need to log in
In chrome (and apparently in your safari too) devtoolz bug, tag change is not displayed
<g style="pointer-events:visiblePainted" transform="matrix(0.334154, 0, 0, 0.334154, -3855.38, -1507.44)" image-rendering="auto" shape-rendering="auto">
...
</g>transform, you can select it and look through it in the console $0.getAttribute('transform')after changing the scale or position. Didn't find what you were looking for?
Ask your questionAsk a Question
731 491 924 answers to any question