Answer the question
In order to leave comments, you need to log in
Complicated. How to make an animated trail from the cursor?
I have such a trace of the cursor on my site: It is
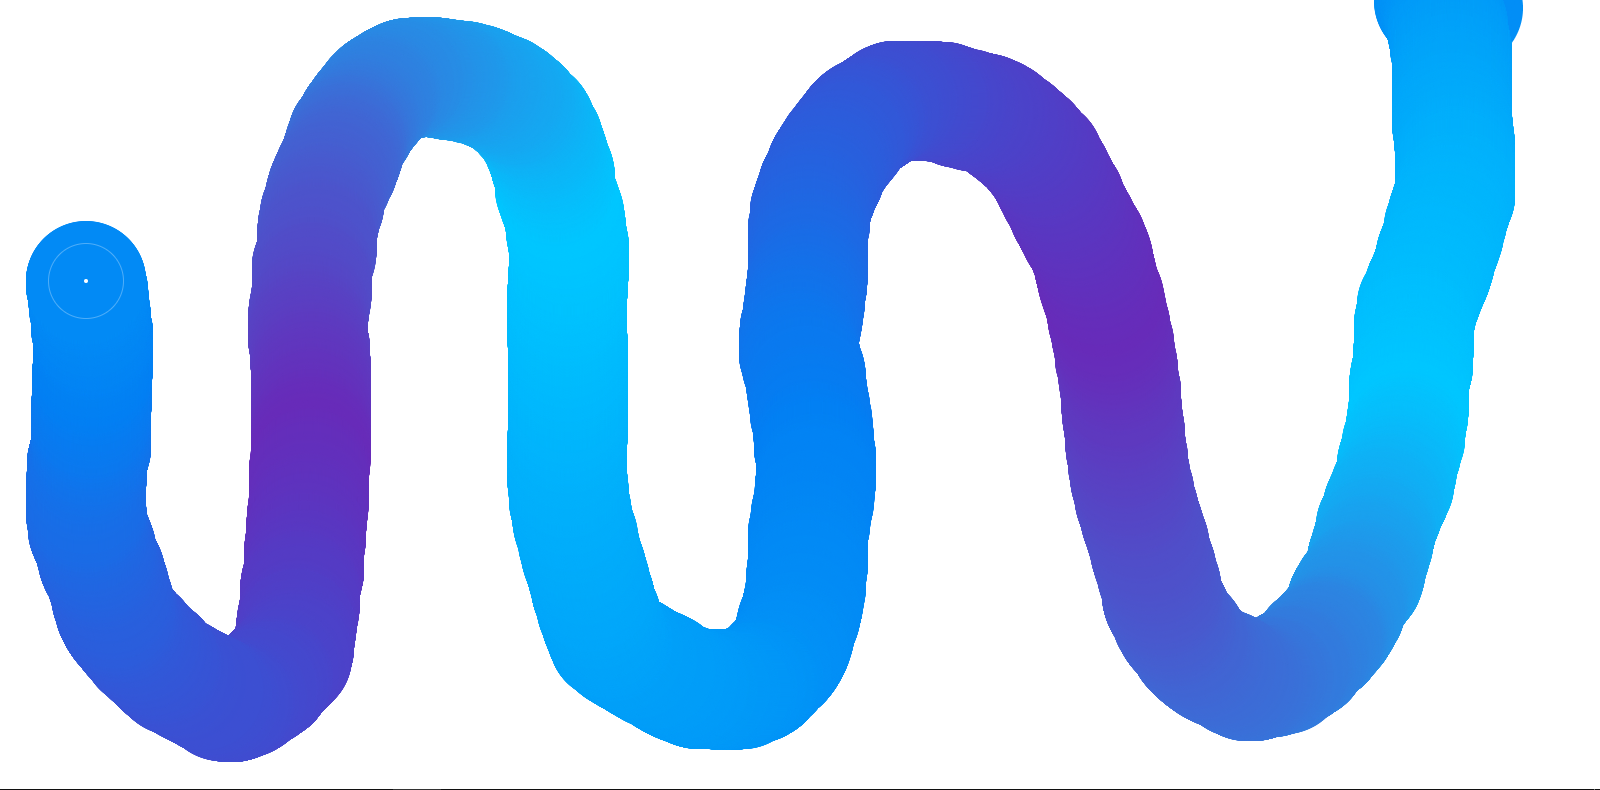
implemented as follows (all on canvas):
When the mouse moves (mousemove), the coordinates of two points (start and end) are fixed.
Circles are drawn between these points, the color of which is calculated differently all the time, thus, a gradient line is obtained.
The problem is this:
The client wants the gradient to be animated, for example, so that the color shimmers.
In order for me to do this, I need to erase the canvas and draw the drawn circles each time with a new color to create a transfusion effect. And in order to redraw erased circles, I have to store somewhere the coordinates of the points between which they were drawn.
How can I do this if there are too many dots and it loads the browser?
And in general, is it right that I immediately switched to canvas, or could this be done without it?
var c = document.querySelector("canvas");
    var ctx = c.getContext("2d");
    var colors = [
        {r: 2, g: 127, b: 243},
        {r: 0, g: 198, b: 255},
        {r: 103, g: 43, b: 185},
    ];
    var cIndex = 0;
    var maxColors = colors.length;
    var total = 0;
    var segment = 1500;
    var px, py;

    setSize();


    window.onmousemove = function (e) {
        plot(e);
    };


    function getPos(e) {
        var r = c.getBoundingClientRect();

        return {
            x: e.clientX - r.left,
            y: e.clientY - r.top
        }
    }

// plot вызывается при движении мыши
    function plot(e) {
        var pos = getPos(e);
        plotLine(ctx, px, py, pos.x, pos.y);
        px = pos.x;
        py = pos.y;
    }
// тут вычисляется цвет
    function getColor() {
        var r, g, b, t, c1, c2;

        c1 = colors[cIndex];
        c2 = colors[(cIndex + 1) % maxColors];
        t = Math.min(1, total/segment);

        if (++total > segment) {
            total = 0;

            if (++cIndex >= maxColors)
                cIndex = 0;
        }

        r = c1.r + (c2.r - c1.r) * t;
        g = c1.g + (c2.g - c1.g) * t;
        b = c1.b + (c2.b - c1.b) * t;

        return `rgb(${r}, ${g}, ${b})`;
    }
// здесь отрисовка окружностей между двумя точками
    function plotLine(ctx, x1, y1, x2, y2) {
        var diffX = Math.abs(x2 - x1);
        var diffY = Math.abs(y2 - y1);
        var dist = Math.sqrt(diffX*diffX + diffY*diffY);
        var step = dist/10;
        var i = 0;
        var t, x, y;


        while (i < dist) {
            t = i/dist;

            x = x1 + (x2 - x1) * t;
            y = y1 + (y2 - y1) * t;


            ctx.fillStyle = getColor();
            ctx.beginPath();
            ctx.arc(x, y, 60, 0, Math.PI*2);
            ctx.fill();
            i += step;
        }
    }


    window.onresize = setSize;
    function setSize() {
        c.width = window.innerWidth;
        c.height = window.innerHeight;
}Answer the question
In order to leave comments, you need to log in
Didn't find what you were looking for?
Ask your questionAsk a Question
731 491 924 answers to any question